

AIM OF THE EXPERIMENT
This test is performed to determine the relationship between the moisture content and dry density of a soil for a specified compactive effort.
CODE OF REFERENCE
IS 2720 (Part 2)- 1980 Methods of test for soils: Part 7
Determination of water content- dry density relation using light compaction.
IS 2720 (Part 2)- 1973 Methods of test for soils: (Part 2)
Determination of water content.
APPARATUS USED
- Compaction mould 1000 ml capacity.
- 6 kg rammer
- Detachable base plate
- Collar 60 mm high
- IS Sieve 4.75 mm
- Oven
- Moisture cans
- Desiccator
- Weighing balance with accuracy of 1g
- Large mixing pan
- Straight edge spatula
- Graduated jars
- Mixing tools, spoons, trowels.
- Steel ruler
- Vernier callipers
- Thermostat
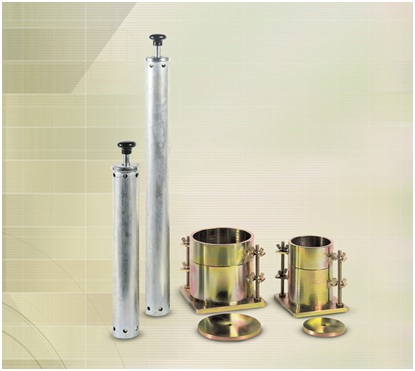
Fig 1: Proctor moulds and rammers
COURTESY: CONTROLS GROUP
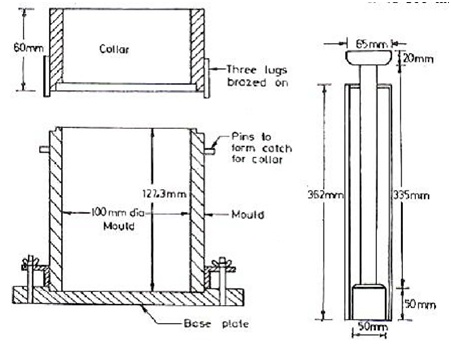
Fig 2: Diagrammatic representation of standard proctor compaction equipment.
COURTESY: RESEARCHGATE
SOIL SPECIMEN
The soil specimen used must pass through 4.75 mm IS Sieve.
THEORY
Conduction od Proctor’s compaction test is based on the assessment of water content and dry density relationship of a soil for a specified compactive effort. The mechanical process of densification through reduction of air voids in the soil mass is called compaction. The amount of mechanical energy which is applied to the soil mass is the compactive effort. There are many methods to compact soil in the field, and some examples include tamping, kneading, vibration and static load compaction. This test will employ the tamping or impact compaction method using the type of equipment & methodology developed by R. R. Proctor in 1933, hence, the test is also known as the Proctor test.
Usually, two types of test are performed:
1. The Standard Proctor test and
2. The Modified Proctor tests.
In the Standard Proctor Test, the soil is compacted by a 2.6 kg rammer falling at a distance of 310 mm into a soil filled mould. The mould is filled with three layers of soil and each layer is subjected to 25 blows of rammer. The Modified Proctor Test is identical to the Standard Proctor Test except it employs a 4.89 kg rammer falling at a distance of 450 mm & uses five equals of soil instead of three.
The bulk density in g/ml of each compacted specimen shall be calculated from the equation:
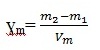
where, m1 = mass in g of mould and base;
m2 = mass in g of mould, base and soil and,
Vm = Volume in ml of mould
The dry density in g/ml of each compacted specimen shall be calculated from the equation:
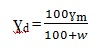
where, w = moisture content of soil in percent.
SIGNIFICANCE OF THE EXPERIMENT
- One of the most common as well as effective means of stabilizing soils is mechanical compaction. The most important work of geotechnical engineers is the performance as well as analysis of field control tests to assure that the compacted fills are meeting the prescribed design specifications.
- Required density (as a percentage of the maximum density measured in a standard laboratory test), and the water content are measured in this test.
- The optimum water content which results in the greater density for a specified compactive effort is measured as compacting at water contents higher than the optimum water content results in a relatively ductile, less pervious, softer, more susceptible to shrinking & less susceptible to swelling than soil compacted dry of optimum to the same density.
- The soil which is compacted leads to a flocculated soil structure that has the opposite characteristics of the soil compacted wet of the optimum water content to the same density. This helps in construction to a great extent.
- If this property is not evaluated then the structure built will fail and soil will not stabilize under effective costs.
PROCEDURE
1. The mould with base plate is cleaned and dried and weighed it to measure the nearest 1 gm.
2. Grease is applied on the mould along with base plate and collar completely.
3. About 16- 18 kg of air-dried pulverised soil is taken.
4. 4% of water is added to the soil if the soil is sandy and about 8% if the soil is clayey & mixed it thoroughly. The soil is kept in air tight container and allowed it to mature for about an hour.
5. About 3 kg of the processed soil is taken and divided into approximately three equal portions.
6. One portion of the soil is put into the mould and compacted it by applying 25 number of uniformly distributed blows.
7. The top surface of the compacted soil is scratched using spatula before filling the mould with second layer of soil. The soil is compacted in the similar fashion as done in for the first layer and scratched it.
8. The same procedure for third layer is also repeated.
9. The collar is removed & trimmed off the excess soil projecting above the mould using straight edge.
10. The mould is cleaned and also the base plate from outside & weighed in to the nearest gram.
11. The soil is removed from the top, middle and bottom of the case and the average of water content is determined.
12. About 3% water or a fresh portion of the processed soil is added and the steps from 5 to 12 are repeated.
OBSERVATIONS AND CALCULATIONS
| Sl no. | Observations and calculations | Trial number | ||||
| 1 | 2 | 3 | 4 | 5 | ||
| 1 | Diameter of mould (D) m | |||||
| 2 | Height of mould (H) cm | |||||
| 3 | Mass of empty mould and base (in g) | |||||
| 4 | Mass of mould, base plate and compacted soil (in g) | |||||
| 5 | Moisture content during compaction in % | |||||
| 6 | Weight of soil (g) | |||||
| 7 | 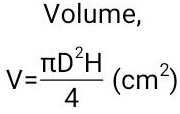 |
|||||
| 8 | 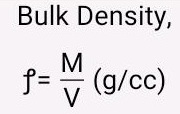 |
|||||
| 9 | 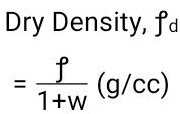 |
|||||
| 10 |  |
|||||
| 11 |  |
|||||
MOISTURE CONTENT
| Sl no. | Container ID | Weight of empty container in gm | Weight of container + wet soil in g | Weight of container + dry soil in g | Weight of water in g | Weight of dry soil in g | Moisture content in percentage |
| 1 | S-1 | ||||||
| 2 | S-2 | ||||||
| 3 | S-3 | ||||||
| 4 | S-4 | ||||||
| 5 | S-5 |
DISCUSSION
The maximum dry density in g/cm3is to be reported to the nearest 0.01 and the optimum moisture content is to be reported to the nearest 0.5. The graph between γd v/s w (%) is plotted and the maximum dry unit weight of compaction, γd(max)is determined. The moisture content which is optimum is also determined corresponding to γd(max). The dry densities obtained in a series of determinations are plotted against the corresponding moisture content which gives smooth curve with convexity upward. At first the dry unit weight after compaction increases as the moisture content increases but after the optimum moisture content percentage is exceeded, any added water will result in a reduction in dry weight because the pore water pressure will be pushing the soil particles apart, decreasing the friction between them.
REMARKS
- The soil used in this test passes through 4.75 mm IS Sieve. Aggregates of particles was broken down. After optimum moisture content no more dry density tends to increase.
- Brush should be used so that the particles on the mould do not get added to the weight taking process.
- Grease should be applied properly and completely so that particles don’t stick.
- Hand gloves and safety shoes while compacting should be worn.
- Adequate period should be allowed after mixing the water and before compacting into the mould.
- The blows must be uniformly distributed over the surface of each layer in order to have best results.
- For construction it is often necessary to compact the soil to improve its strength.
- This test is based on the compaction of soil fraction passing through No. 4.U.S. Sieve.
If you have a query, you can ask a question here.
Very good
Thanks for providing sufficient information.
How to use odd and omc value obtained in field?