

It is one of the types of geophysical methods in civil engineering. It is based on the measurement and recording of changes in the mean resistivity or apparent specific resistance of various soil. The resistivity of soils is a complicated function of porosity, permeability, ions present in the pore water, and clay mineralization. The most common electrical methods used in hydrogeological ad environmental investigations are vertical electrical sounding (resistivity sounding) and resistivity profiling. The resistivity ρ is defined as the resistance between the opposite faces of a unit cube of material. The variations in resistivity can be detected significantly between different types of soil strata, above or below the water table, between unfissured rock and soil, between voids and soil or rock.
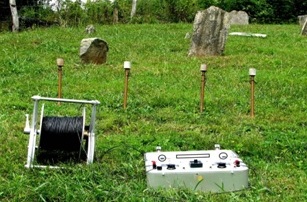
Fig 1: Electrical resistivity method used in field
Electrical Resistivity Method is used to know the following:
- To determine the depth of groundwater table.
- To determine the depth to bedrock or overburden thickness.
- To determine map stratigraphy.
- To determine map clay aquitards.
- To determine the vertical extent of certain types of soil and groundwater construction.
- To estimate landfill thickness.
The test is carried out by driving four metal spikes to serve as electrodes into the ground along a straight line at equal intervals. Here, the electrode spacing is kept fixed. The measurements are taken at successive intervals along a profile. Data are generally presented as profiles or contour maps and interpreted qualitatively.
The test is carried out by driving four metal spikes to serve as electrodes into the ground in a straight line in equal intervals. Current from the battery flows through the soil between the outer two electrodes. It produces electric current within the soil. The potential difference E between the two electrodes is then measured. The resistivity Ω is measured by the following equation:
ρ=2πDE/I
Here, D is expressed in cm, E is in volts, I is in amperes, and ρ is in ohm-cm.
In an area of a large volume of soil, the apparent resistivity is measured as a weighted average of true resistivity up to a depth of D. The soil close to the surface is more heavily weighted than the soil at greater depths. If a stratum of low resistivity overlies a stratum of higher resistivity, the current is forced to flow closer to the ground surface. It results a higher voltage drop and hence a higher value of apparent resistivity. It would be just the opposite if a stratum of high resistivity lies above the stratum of low resistivity.
When the variation of resistivity with depth is required, the method of sounding is used. This provides rough estimates of the types and depths of strata. A series of readings are taken with each successive readings corresponding to the increased equal spacing of electrodes. The center of four electrodes is kept at a fixed point. As the spacing is increased, the resistivity is greatly influenced by the depth of soil. If the resistivity increases with an increase in spacing of electrodes, it can be said that the underlying stratum is having high resistivity. But if the resistivity decreases, it can be said that the lower resistivity of the underlying stratum is beginning to influence the reading. If its influence is observed over a greater spacing of the electrodes, the thickness of the stratum is larger.
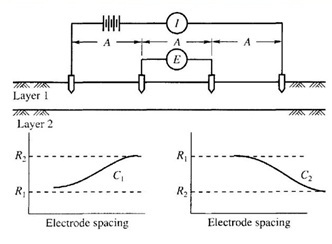
Fig 2: Electrical resistivity method and graphs
Apparent resistivity is plotted against electrode spacing in a log-log graph. If the resistivity of the upper layer is lower than that of the lower layer, a curve type A is obtained. The curves become asymptotic to lines representing the true resistivities R1 and R2 of the representative layers. Approximate layer thickness can be obtained by comparing the observed curve of resistivity versus electrode spacing with a set of standard curves.
The profiling method is used when the lateral variation of soil strata is to be investigated. A series of readings are taken, keeping the electrode spacing the same, the four electrodes are moved laterally as a unit for successive reading. Apparent resistivity is plotted against the center position of the four electrodes, to a natural scale. These plots can be used to locate the positions of the soil of high or low resistivity.
If you have a query, you can ask a question here.