

By
Rahul
Department Of Civil Engineering, AWH Engineering College, Calicut-8,Kerala
ABSTRACT
This seminar paper on LiDAR mapping provides an introduction to a maturing technology used to acquire land based Digital elevation Models (DEM), and an existing mature technology used to acquire marine (undersea) DEMs. This seminar also goes through the use of LIDAR in space programs. Common to both the land-based and marine based systems by the use of lasers, integrated into what are known as Light Detection And Ranging systems, or LiDAR. The seminar begins with an introduction to LiDAR, and follows-through with how the systems are used, a description of land and marine variants, and statements as to what accuracy is attainable. Data products driven by applications are outlined, and the ability of these products to be integrated into a GIS is addressed. In turn and integral to the theme of the paper, evidence is presented to support applications developments that will ultimately benefit the public at large. Where valid, comparisons of LiDAR to other mapping technologies are presented to give the reader an understanding of current traditional practices. In many cases the combination of Li-DAR with other technology creates a result that is unachievable with a single methodology. Finally, conclusions are presented for discussion purposes that draw on the experiences of LiDAR.
INTRODUCTION
WHAT IS LIDAR?
On a functional level, LiDAR is typically defined as the integration of three technologies into a single system capable of acquiring data to produce accurate digital elevation models (DEMs). These technologies are lasers, the Global Positioning System (GPS), and inertial navigation systems (INS). Combined, they allow the positioning of the footprint of a laser beam as it hits an object, to a high degree of accuracy. Lasers themselves are very accurate in their ranging capabilities, and can provide distances accurate to a few centimetres. The accuracy limitations of LiDAR systems are due primarily to the GPS and IMU (Inertial Measurement Unit) components. As advancements in commercially available GPS and IMUs occur, it is becoming possible to obtain a high degree of accuracy using LiDAR from moving platforms such as aircraft.
How Does It Work?
A LiDAR system combines a single narrow-beam laser with a receiver system. The laser produces an optical pulse that is transmitted, reflected off an object, and returned to the receiver. The receiver accurately measures the travel time of the pulse from its start to its return. With the pulse traveling at the speed of light, the receiver senses the return pulse before the next pulse is sent out. Since the speed of light is known, the travel time can be converted to a range measurement. Combining the laser range, laser scan angle, laser position from GPS, and laser orientation from INS, accurate x, y, z ground coordinates can be calculated for each laser pulse. Laser emission rates can be anywhere from a few pulses per second to tens of thousands of pulses per second. Thus, large volumes of points are collected. For example, a laser emitting pulses at 10,000 times per second will record 600,000 points every minute. Typical raw laser point spacing on the ground ranges from 2 to 4 meters.
Some LiDAR systems can record “multiple returns” from the same pulse. In such systems the beam may hit leaves at the top of tree canopy, while part of the beam travels further and may hit more leaves or branches. Some of the beam is then likely to hit the ground and be reflected back, ending up with a set of recorded “multiple returns” each having an x, y, z position. This feature can be advantageous when the application calls for elevations for not only the ground, but for tree or building heights. As surface types and characteristics vary and change the laser beam’s reflectivity, then the ability of the LiDAR to record the return signals changes. For example, a laser used for topographic applications will not penetrate water, and in fact records very little data even for the surface of the body of water. Where the application calls for a laser to penetrate water to determine x, y, z positions of undersea features, then a slightly different variation of LiDAR technology is used.
WHERE ARE LIDAR TECHNOLOGY USED?
1. 3 dimensional modelling of structures(LiDAR data is used in auto cad)
2. Space and planetary studies
3. Urban modelling
4. Oil and gas exploration surveys
5. Transportation studies and surveys including road, rail, air and sea.
6. Climatic study
7. Earth quake study (SIESMOLOGY) and disaster management
8. Flood risk mapping
9. Forestry
10. Power line transmission and pipe line corridor planning
11. Engineering and construction surveys
12. Undersea cable routing
13. Real estate development
14. Canopy studies
15. Coastal zone mapping
16. Study on airport exclusion zones
17. High resolution mapping
18. Rectification of satellite imagery
19. Oceanic study
20. Atmospheric study
21. Study about composition of distant objects
LiDAR acquisition platforms
LiDAR installation can be set up on wide range of platforms such as
1. Fixed wing aircrafts
2. Helicopters (HELIX installation)
3. Satellites
4. Tripods
5. Robots
6. Automobiles etc
Hydrographic LIDAR v/s. Topographic LIDAR
Airborne LiDAR Hydrography (ALH) has been under development since the mid 1960s. There are currently half a dozen ALH systems in operation, and one of the most advanced and reliable is the Scanning Hydrographic Operational Airborne LiDAR Survey, or SHOALS system. It has been described as one of the most versatile hydrographic LiDAR systems in use in the world today. To my knowledge there is only one SHOALS system in operation, and it is owned by the United States Army Corps of Engineers. There are several fundamental differences between a SHOALS system and a topographic Li-DAR system. The principle difference is that the SHOALS system uses two varying laser beams whereas most topographic systems use a single beam. In addition, the wavelengths of the laser in each are different. Most topographic LiDAR uses near infrared beams that reflect off most objects. The SHOALS system uses a red wavelength (infrared) beam that is reflected by the water surface and detected by the receiver, as well as a blue-green wavelength beam which penetrates the water surface and is reflected from the bottom. As shown in the graphic on the left, a hydrographic LiDAR fires co-aligned laser pulses of the two different wavelengths at the water. The time difference between the two signals determines the water depth. Another major difference between a topographic and SHOALS system is the frequency of the emitted laser beam. Whereas a topographic LiDAR emits beams at up to 30,000 Hz, the SHOALS system operates at relatively low frequency, emitting pulses at 400 Hz. A final interesting difference between the SHOALS LiDAR and a typical topographic LiDAR is the disparate energy requirements of each. Whereas a topographic system can be used in a relatively small aircraft or helicopter, the SHOALS system requires much more power to operate. This is due to the power required to energize a laser beam such that it can penetrate the water to the depths necessary to map the ocean floor. Typically, marine LiDAR can measure the depth of water down to about 50 meters depending on the turbidity, or clarity of the water. This is one of the major limiting factors when considering a SHOALS system for underwater applications.
Choices within Topographic Lidar system
Most topographic LiDAR systems are used in small to medium fixed-wing aircraft. These aircraft may require some additional fitting for mounts and power supplies, but it is usual that an aircraft equipped to conduct aerial photography can be used to fly current commercially available LiDAR systems. There are a number of topographic LiDAR systems that can be fitted to operate in helicopters, (HELIX system)and several have been designed to be exclusive to this type of platform. Systems are currently operated on helicopters ranging from Robinson R44s, to Enstrom F28s, Bell 206 Jet Rangers and Aerospatial AS350 aircraft. The SHOALS system requires a much larger platform, something that might range from a DeHavilland Twin Rotter aircraft to a Bell 212 helicopter. It stands to reason that the bigger the aircraft the more expensive it is to operate. For example, today’s commercial rates for a Bell 212 helicopter might be in the range of $3,000 per hour, while a Bell 206 Jet Ranger might be hired at a cost of $900 per hour. LiDAR systems are also operated by NASA on space borne platforms including the Space Shuttle and satellites.
Expected Accuracies
There are many factors that affect the accuracy attainable by a LiDAR system. The system components (i.e., GPS, IMU, and laser) all have inherent accuracy limitations, which for the most part are understood and can be predicted. Other factors affecting end product accuracy arise from flight planning and flying conditions, atmospheric effects, terrain undulation and vegetation cover. Experienced LiDAR practitioners are careful to assess all these factors when planning and executing projects. It is also important that contracting agencies establish a quality control plan with contractors to include sufficient ground survey checks (ground truthing) to validate data in representative regions of a project area. Given that it is possible to ascertain the errors associated with the GPS, IMU and laser, the resultant accuracy of LiDAR points (x, y, z) is best described as a function of terrain type and vegetation cover. For any given point accuracy achieved, and where the density of points (laser point spacing) is sufficient, the accuracy of the resultant DEM should be a reflection of the point accuracy. In terms of varying terrain and vegetation, the following point accuracy is achievable. Note that all accuracy statements are quoted at the 95% confidence level (2 sigma).
Typical Absolute Vertical Accuracy:
• +/- 0.15 meters on Hard Surfaces and Open Regular Terrain
• +/- 0.25 meters on Soft/Vegetated Surfaces (flat to rolling terrain)
• +/- 0.30 to 0.50 meters on Soft/Vegetated Surfaces (hilly terrain)
Typical Absolute Horizontal Accuracy:
• +/- 0.50 to 0.75 meters on all but extremely hilly terrain (depends on flying height and beam divergence)
In areas of extremely dense vegetation, such as second growth forests and/or tropical rain forests, the percentage of laser points that penetrate to the ground decreases, and this affects the accuracy of the resultant DEM. Careful survey practices are required to ensure that a reliable DEM is generated under these conditions.
Typical Absolute Vertical Accuracy:
• +/- 0.15 meters (Depending on turbidity of the water)
Typical Absolute Horizontal Accuracy:
• +/- 3.0 to 15 meters
Although not as easy to “ground truth” as topographic LiDAR, it is possible to deploy undersea reflectors from which the blue-green LiDAR wavelength is returned. These reflectors are also used to ascertain the turbidity of the water, by varying the depth of the reflector and analyzing the return signal.
A COMPARISON BETWEEN LIDAR SURVEY AND CONVENTIONAL SURVEY TECHNOLOGIES
Accuracy; LiDAR is much more precise than any other surveying techniques; it offers 15cm vertical accuracy and 50 cm horizontal accuracy.
Some factors affecting accuracy of LiDAR;
• Quality of the hardware and software
• Knowledge of the planners, operators, office staff
• Flying height
• Scan angle (also important for vegetation penetration)
• GPS configuration (PDOP and Number of SVs)
• Distance from base station to aerial platform
• Laser power
• Laser rep rate
Cost : The cost of LiDAR technology does not increase with the increase in the area of survey, so for large areas the survey will be cheaper than other technologies.
Speed : Time to collect one million points
1. Conventional Surveying: 15.5 years
2. Photogrammetry: 1.5 years
3. LiDAR: 6.7 seconds @ 150 kHz
Flexibility : LiDAR data acquisition is possible on variety of platforms which makes it highly adaptable to dangerous situations and provides access to survey at areas where other methods of survey are difficult to conduct( very dense forests, areas under risks like radio activity, in accessible marshy lands etc.)
LiDAR data is compatible with many of the engineering soft wares like AUTOCAD, which makes it even more dependable than other methods of surveying.
LiDAR data products & GIS
One of the inherent features of LiDAR data is that it is acquired, processed, and delivered in a digital format. This makes it very easy to work with LiDAR, and to create data products that meet a wide range of needs. The simplest form of data acquired from LiDAR is an ASCII format file containing x, y, z coordinate data. This coordinate data corresponds to the geographic 3-D position of an actual LiDAR return. The return and associated coordinate could be the position of a return off the ground, a building, a tree, or any other object that the laser beam has hit and been reflected from.
The ASCII x, y, z files can be imported into various software packages, and especially GIS. Data manipulation can create a wealth of products, and augmenting or fusing other types of data with LiDAR can produce valuable results. For instance, it is possible to import the x, y, z points into a GIS, create a raster gridded DEM, and use the DEM to create shaded surface models that are highly realistic. With the same DEM, it is possible to create orthomaps (often referred to as Digital Ortho Images) by fusing the data with images acquired by conventional aerial photography or digital imaging cameras. For a less accurate overview of the subject area being surveyed, the SHOALS system and many topographic LiDAR systems record VHS or SVHS video imagery. The video can be viewed stand-alone or it can be fused with the DEM to produce a less accurate but still valuable map product.
LiDAR also lends itself to the development of non traditional 3-D products that provide appealing visualizations to meet a number of needs. Using off-the-shelf software, it is possible to input a series of orthomaps and DEMs and to create animated clips on a PC. These clips might for example depict a roadway, river valley, urban core or forest grove, and can lend high visibility to a presentation or study. To add even more value, computer animation and graphics can be added to the 3-D “fly through” to create stunning vistas and effects.
Since LiDAR data can be imported and exported by most commercially available GIS packages, this infers that the vast majority of available raster and vector formats can be supported with LiDAR data as the basis. For example, programs such as AutoCAD, Arc View, and ERDAS to name but a few, all have the capability to import and export LiDAR data in one form or another. The major stumbling block of many present day software packages — GIS, CAD or otherwise — is that they are limited in the number of points that can be handled at any one time. Considering that a typical topographic or hydrographic LiDAR program can cover hundreds of square kilometres, and each square kilometre may contain millions of points, the data bottleneck becomes obvious.
Many LiDAR practitioners have developed proprietary software to handle the data volumes, and commercial GIS and photogrammetric software developers are beginning to address the problem. As computers become faster and more powerful, and assuming software follows the same trend, it will become easier for service providers and clients alike to manipulate LiDAR data.
Although not exhaustive, the following list of applications served by LiDAR data provides an insight into what is possible.
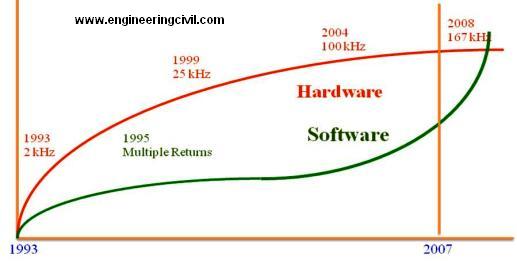
Evolution of LiDAR accuracy
Applications And Examples of LiDAR
Flood Risk Mapping
LiDAR surveys are one of the quickest and most accurate methods to produce a DEM. Using the LiDAR derived DEM, hydrologists are able to predict flood extents and plan mitigation and remediation strategies. The reliability of flood risk mapping and hydrological models is dependent on the accuracy of the terrain elevation data used. This is especially true for modelling in areas of little terrain relief. For example, in a flat river basin such as the Red River in Manitoba and North Dakota, a slight increase in water level can flood a large area. This may mean that many communities would be affected by a rise in water level. In areas with more relief, the accuracy of the DEM is not as critical, but knowledge of slope and aspect can aid considerably in predicting water volumes and flow characteristics. The following is an excerpt from the IJC’s final report “Living with the Red”, and is based on the results of LiDAR surveys done in the region: “The Task Force found that current mapping of high risk areas was not adequate for modelling and analysis of flood risk, or for the consideration of flood protection options. Among other things, the Task Force produced high-resolution digital elevation data for the lower Pembina River and for the area south of the Winnipeg Floodway, and analyzed data collection technologies. Through these efforts, the Task Force found that airborne laser mapping can be a fast, reliable, and cost effective method of obtaining three-dimensional data suitable for the creation of a digital elevation models (DEM).”
Oil & Gas Exploration Surveys
The oil and gas industry relies upon rapid delivery of time sensitive data relating the X, Y and Z positions of terrain data for exploration programs. Although this critical positional data can be collected by alternate means, LiDAR surveys provide high-speed data acquisition and limit ground intervention. In many instances, the time from field survey to final data product delivery can be accomplished within a few weeks, not months. In environmentally sensitive areas, tree-cutting fees can amount to thousands of dollars per hectare. Using LiDAR as the survey tool, fewer lines need to be cut, fewer trees are felled, and the exploration companies realize significant savings. Typically, surveys for the oil and gas industry are conducted using either a fixed-wing or helicopter mounted LiDAR system, based on the size, terrain, and vegetation coverage of the project area.
Engineering/Construction Surveys
LiDAR surveys are well suited for producing accurate elevation data for engineering surveys of road and other construction projects. Using DEMs created from LiDAR, cut and fill quantities can be more precisely estimated during planning stages when compared to ground survey or photogrammetric techniques. The DEM can also be used in conjunction with GIS and CAD software to enable planners and engineers to model various scenarios in choosing the best route or location for future construction. “As-built” surveys can be used as a stand-alone record of construction, or as a comparison with the pre-construction survey to validate initial quantity estimates. Combining a LiDAR DEM with orthophotos can provide an engineering design team with all the topographic and planimetric information they need. Using LiDAR survey technology, the time between data acquisition and delivery of the finished DEM/Orthophoto product to the client can be far shorter than any other survey methodology, an important consideration for time sensitive projects. Throughout North America, various DOTs have carried out LiDAR surveys of new and existing road corridors over the past several years. In areas around the world, LiDAR surveys would aid considerably in constructing and/or improving primary and secondary roadways.
Real Estate Development
Traditional ground surveying for real-estate development purposes is a time consuming and labour intensive task because of the accuracy and precision requirement of the DEM. Airborne LiDAR surveys offer real estate developers a cost effective way to quickly obtain precise topographic and elevation data in urban, suburban, and rural areas with minimal human presence on the ground. Developers frequently require a DEM accurate to within 15 cm, thereby enabling them to optimize lot design, as well as excavation and fill requirements. Adding high-resolution digital orthophoto provides developers, town planners, engineers, and contractors with all the digital data needed to plan new infrastructure and development projects. A recent LiDAR project was conducted for a land developer on Vancouver Island that included the derivation of a DEM along with orthophoto for mapping and planning purposes.
Power Line Transmission Or Pipeline Corridor Planning
LiDAR technology lends itself particularly well to transmission line surveys, especially if the data acquisition system is mounted in a helicopter. Using a helicopter for corridor mapping can be much more cost-effective than a fixed-wing, since the helicopter can follow the corridor’s path easily, staying directly over the power line or pipeline at all times. A helicopter system can also ensure that a rigorous data set is acquired, since flight speed and altitude can be adjusted as necessary during flight. With the addition of a digital still camera, a video camera, or other sensors to the helicopter pod, inventory mapping and line inspection can be undertaken at the same time as the LiDAR survey. LiDAR and image data can be used for several applications in corridor mapping including:
• Calculating power line heights or sag under different loads
• Inventory
• Tower Placement
• Height of underlying vegetation
Several hydro utilities have conducted LiDAR based data collection projects to evaluate the technology, and now are using the LiDAR data operationally for line re-rating, tower/line re-engineering and new line site selection.
Coastal Zone Mapping
Traditional photogrammetry is sometimes difficult to use in areas of limited contrast and featureless terrain, such as beaches and various coastal zones. An active sensing technique such as LiDAR mapping offers the ability to complete surveys that would be more difficult using other methods. In addition, highly dynamic environments such as coastal zones often require frequent updating of baseline survey data. LiDAR offers a cost-effective method to do this on a regular basis. LiDAR is also used for the mapping and monitoring of shore belts, dunes, dikes, coastal forests, and for modelling storm surges or sea level rise. One of the more interesting coastal zone projects conducted recently was a LiDAR survey of a section of the Annapolis coastal and valley region of Nova Scotia, under a research project sponsored by the Canadian Foundation for Innovation, and under the auspices of the College of Geographic Sciences (COGS). The data will be used to model different levels of storm surges and sea level rise in order to identify areas that are in danger of flooding. The LiDAR data is also being used to validate the accuracy of high-resolution image sensors such CASI and IKONOS. A SHOALS system is a good tool for near shore and coastal zone applications, since it can provide the undersea elevation model for merging with the onshore elevation model.
Forestry
One of the first areas investigated for commercial application of LiDAR was the forest industry. Accurate information of the terrain and topography beneath the tree canopy is extremely important to both foresters and natural resource managers. Accurate information on tree heights and densities is critical information that is difficult to obtain using conventional techniques. Airborne laser technology, unlike radar or satellite imaging, can simultaneously map the ground beneath the tree canopy as well as the tree heights. Post-processing of the data allows the individual laser returns to be analysed and classified as vegetation or ground returns, allowing for both a ground DEM and a tree canopy model. Using application- specific software it is possible to compute information related to the forest industry such as; tree heights, crown cover and biomass. Consequently, airborne laser mapping is an extremely effective tool for forestry companies especially when compared to traditional tools such as photogrammetry or ground surveys. There is still much work to do in developing reliable and robust modelling software for the forest industry, and this is an area where university research is playing a role.
Urban Modeling
Accurate digital models of urban environments are required for a variety of applications including telecommunications, wireless communications, law enforcement and disaster planning. Using the proper operational parameters, LiDAR offers the ability to accurately map urban environments without shadowing. Detailed Surface Elevation Models (SEMs) can be extracted from the LiDAR data, and enhanced for applied analysis using specialized 3-D rendering software.
Wetlands And Other Restricted Access Areas
Many environmentally sensitive areas such as wetlands, wildlife reserves, and protected forest areas are difficult to map using conventional ground or photogrammetric techniques. This is due to often dense vegetation cover and limited access roads, which make it difficult to access for ground surveys, and inherently difficult to map using traditional photogrammetry. Airborne LiDAR mapping offers the capability to survey these areas. The technology can also be deployed to survey toxic waste sites or industrial waste dumps.
Other Applications
Miscellaneous other applications of LiDAR include the following:
• Property assessment, where county-wide mapping programs are being supported by LiDAR;
• Airport Exclusion zones, where landing and takeoff zones are mapped with LiDAR to detect obstructions that rise above regulatory height restrictions;
• Rectification of Satellite Imagery, where Li-DAR is used to provide the DEM to complete the satellite image rectification process.
SHOALS specific applications
While most of the preceding applications have been directed at topographic LiDAR systems, there are several key applications that can only be conducted with a hydrographic LiDAR.
Undersea Cable Routing
With more and more cables being placed underwater, the demand for precise information of the seafloor structure is increasing. Although not applicable in a deep-water situation, a hydrographic LiDAR can provide data to ascertain the best possible routing for a subsurface cable in water depths of up to 50 meters. Given that the shallower waters in the near shore regions are likely the most populated with underwater “furniture”, a LiDAR system may be the only way to gather the data required. Additionally, it has been documented that other underwater sensors such as Multi Beam Sonar (MBS) are difficult to operate and are less reliable in shallower waters.
Wreck Detection
Several projects have been conducted using Li-DAR to detect underwater shipwrecks, especially in shallower waters. With the ability of LiDAR to operate in these depths of water, and given the accuracy of the system, it has been shown that the technology is a viable way to detect and identify sunken ships.
Charting & Safety Issues
Electronic Charts are replacing paper maps for navigation at sea, in harbors and in ports. Various data is required to compile the charts, and hydrographic LiDAR is capable of providing data to support their generation. Combined with soundings, multi beam sonar and other data, the LiDAR component adds extreme value to the end result. One initiative being spearheaded by the Canadian Hydrographic Service is the concept of a seamless chart that encompasses the sea and the land. With the increasing versatility of LiDAR technology, these charts will become a reality.
CONCLUSIONS
LiDAR mapping is a maturing technology, and applications are still being identified and developed as end-users begin to work with the data. There are on-going initiatives to identify areas where the technology allows value-added products to be generated or where it offers significant cost reductions over traditional survey methods. There are a number of conclusions to be drawn from the information presented herein. These deal with LiDAR technology itself, the impact of the technology on the survey and mapping industry, and the societal and economic benefits that accrue through its use. They have been presented below in point form, in no particular order.
1. LiDAR is an enabling technology. Primarily, it has allowed data to be collected that was difficult or impossible to obtain prior to its introduction. This is especially true in the forest industry and utility corridor arena, where it has been very difficult and expensive to get elevation models using ground-based GPS, conventional survey and/or photogrammetric techniques.
2. LiDAR is an enhancing technology. For applications where a more precise DEM is required, such as engineering and road design and flood plain mapping, LiDAR is able to provide much more information than can be acquired by virtually any other means at least within economic reason.
3. LiDAR has revolutionized the survey and mapping world. In practical terms, hydrographic LiDAR has been a viable survey tool since the early 1980s. With the advent of a full constellation of GPS in the early 1990s, hydrographic LiDAR has taken a giant leap forward in being able to provide accurate data for difficult survey operations. Topographic LiDAR has evolved from a relative physics experiment to a useable and reliable survey tool, all since the mid 1990s. Now that the technological “chasm” is virtually crossed, and more people are buying into LiDAR,the survey and mapping industry is racing to meet the demand for services. This includes the industry’s ability to properly acquire, process and quality control the data.
4. LiDAR has empowered clients. The speed with which data can be collected, and the relative speed at which it can be processed compared to any other technology, has given clients the power to demand products more quickly. In many cases, time saved on surveying and mapping translates into huge downstream economic gains.
5. LiDAR saves clients money. For many projects, especially those where DEMs are required for heavily vegetated areas, LiDAR can greatly reduce survey time and effort. This translates directly into cost savings for clients.
6. LiDAR offers flexibility. Although it can be said of data collected via other methods, data collected by LiDAR is extremely versatile. It can be used for anything from power line detection to DEM generation in a second growth forest. This is due to the tremendous point density achieved from LiDAR, its accuracy, and its ability to penetrate to the ground through foliage in vegetated areas.
7. LiDAR is unobtrusive and environmentally friendly. Unlike ground survey techniques, airborne LiDAR can be flown over areas where access is limited, impossible, or undesirable. Apart from the need to validate the LiDAR with ground truthing, it is not necessary to send pervasive ground crews to conduct intense survey operations. LiDAR surveying can also avoid un necessary tree cutting and other practices that can harm the environment.
In conclusion, it is hoped that this paper will have provided an insight into the possibilities of LiDAR, and will elicit discussion regarding the use of Li- DAR to conduct mapping projects. Given the versatility of the technology, and its maturation, it seems logical that any strategic plan or project should at least consider its use.
REFERENCES
JOURNALS;
• White paper on LiDAR by terra point.
• Use of LiDAR in Forestry Applications
March 25, 2004 Workshop
Hosted by Sunpine Forest Products Ltd.
A Division of Weldwood of Canada
• LIDAR PRINCIPLES AND APPLICATIONS*
Robert Burtch
Surveying Engineering Department
Ferris State University
Big Rapids, MI 49307
• FUSION OF HYPERSPECTRAL IMAGES AND LIDAR DATA FOR CIVIL ENGINEERING STRUCTURE MONITORING
A. Brook a, *, E. Ben-Dora, R. Richterb
a Remote Sensing and GIS Laboratory, Tel-Aviv University, Israel – [email protected]
b DLR Institute of Space Systems, Bremen, Germany – [email protected]
• Airborne Altimetric LiDAR Data Processing
Indian Institute of Technology Kanpur
• Working paper on LiDAR mapping in Nepal
Submitted to the Ministry of Forests and Soil Conservation on March 26, 2010
1Gautam, B.R. and 2Kandel, P.N.
SITES
• www.ambercore.com/files/TerrapointWhitePaper.pdf
• http;//lidar/3D%20scanner%20-%20Wikipedia,%20the%20free%20encyclopedia.htm
• http://www.nasa.gov/
• home.iitk.ac.in/…/LiDAR…/Airborne_AltimetricLidar_Tutorial.htm
• www.ferris.edu/faculty/burtchr/papers/lidar_principles.pdf
Books
• Project report on LiDAR survey conducted by IIT Kanpur.
We at engineeringcivil.com are thankful to Er. Rahul for submitting his project report to us. We are hopeful that this will of great use to all those who are studying LiDAR and its importance.
If you have a query, you can ask a question here.
Thank you for sharing your expertise!