

BY
UKPONG, E. C and ABARAOGU, Civil Engineering Department, Faculty of Engineering University of Uyo, Akwa Ibom State, Nigeria.
and
UDECHUKWU JOHN Civil Engineering Department, Faculty of Engineering University of Uyo, Akwa Ibom State, Nigeria.
ABSTRACT
The description and location of geologic formations and water-bearing zones within the study area are discussed. The geologic aquifer in the area are the upper, medium and lower sands. Pumping test and soil sample data were obtained from Ifa Atai, State Secretariat and Ewet Housing Estate all in Uyo metropolis were analysed. The analysis reveals the following Aquifer and well characteristics, permeability (3.74-20.952) m/d, transmissivity (146.13-914.63) m2/d, storativity (0.141-0.181), specific capacity (4.26-28.69) m3/h/m, well efficiency (77.31-95.03%), expected drawdown (4.36-29.34)m. The result shows that the geologic formation have good water-bearing formations with medium sand being predominant. Draw down values after prolonged pumping test are indicative of high well productivity. Generally the aquifers in the study area are permeable and of high storage capacity.
Keywords: Pumping test, soil sample data, geologic formations, aquifer, permeability, and specific capacity.
1.0 INTRODUCTION
As long as the surface of the earth exists, one of the most valuable resources is the water beneath the earth’s surface. Groundwater is stored in the open space and fractures within geologic material such as soil, sand and rock beneath the land surface. Aquifer are the geologic layers that are filled with water and that can transmit enough water to supply a well under normal hydraulic gradients.
The geological formation can store this water at a particular environment and distribute same worldwide. Surface, groundwater has relationships with the geological formation (aquifer) that stores and transmits this water at any given time and quantity.
Groundwater in gravel, silt and sand aquifers is found in pore spaces between the particles whereas ground water in consolidated aquifer is found in fractures within the rock.
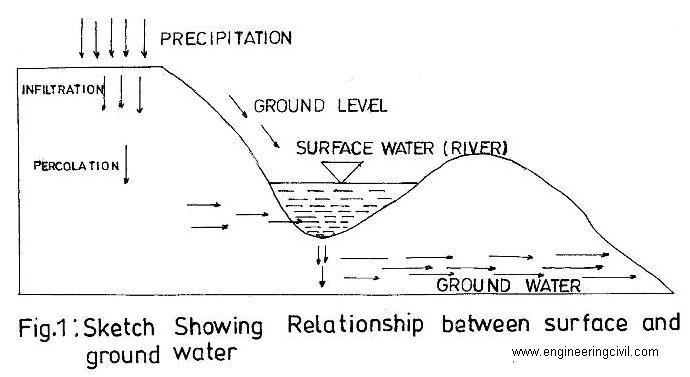
The amount of water a given type of rock can hold depends on the rock’s porosity, which is the volume of pore space between the grains of the sediments or fracture in the rock. The origin of groundwater was the subject of speculation until the 17th century when Perault (1608-1680) and Mariotte (1620-1684), through careful measurement and analysis, demonstrated independently that the source of stream flow and groundwater was precipitation from the atmosphere. Groundwater is precious and the most widely distributed resources of the earth and unlike any other mineral resources, it gets its annual replenishment from the meteoric precipitation. The relationship between surface, groundwater and the geological formation is shown in Figure 1.
Groundwater includes all the water found beneath the earth surface and it is stored in the open spaces and fracture within the geological materials such as soil, sand and rocks that occur beneath the earth’s surface Walton (1970).
For water to move through rocks, the pore spaces must be connected, Linsley (1985). Groundwater flows very slowly within the aquifer and the speed of groundwater movement depends on the size of the spaces within the soil or rock, how well these spaces are connected and the slope (or pressure gradient) of the water table.
The different properties of the geologic materials (aquifer) most of the void spaces in the rock below the water table are filled with water which means that rock have different porosity and permeability characteristics and water does not move around the same way in all rock of geologic formation, Okoro (2001). From this study, the characteristics of aquifer will be examined and analyzed properly within Uyo metropolis. This study therefore is aimed at the determination of the quantity of water and pumping rate during pumping test as well as the determination of areas of potentially productive wells.
Therefore, groundwater is that part of the precipitation that infiltrates through the soil to the water table and is stored in the open spaces and fractures within the geologic materials beneath the earth surface. These geologic materials have openings between particles, crevices (cracks or long narrow openings) joints or fractures solution channels and caverns (underground hollow) which encourage flow through these materials. These materials that serve as underground reservoir is known as Aquifer.
From the integration of information from many well reports over a wide geographic area, hydrogeologist can map regional aquifer and better understand where groundwater occurs and how it is moving.
1.1 CLASSIFICATION OF GEOLOGIC MATERIALS
Geologic materials are classified based on their ability to allow flow through their voids. They include:
1.1.1 Aquitard
An Aquitard is a zone within the earth that restricts the flow of groundwater from one aquifer to another. It is a geologic formation of a rather impervious nature which transmits water at a slow rate but insufficient to feed a well for any meaningful use. They are composed of layers of either clay or non-porous rock with a low hydraulic conductivity.
1.1.2 Aquiclude
This is solid, impermeable area underlying or overlying an aquifer. It is a geologic formation which can store or contain water in any quantity or significant amount such as clay soil. Note that while aquitard can store and transmit very little quantity of water, an aquiclude can store but cannot transmit any quantity.
1.1.3 Aquifuge
This is a solid impermeable area underlying or overlying an aquifer. It is a geologic formation with non inter-connected pores and hence can neither absorb nor transmit water. That is, it does not contain water at all. These materials include dense granite, basalt, clay stone or infrastructured rock.
1.1.4 Aquifer
An aquifer can be defined in different ways by different people. According to Balance et al, (1996), an aquifer can be defined as a permeable rock or geologic formation that contain and transmit water to a well or spring. It can also be described as an underground water reservoir in the water cycle. An aquifer is an underground layer of water-bearing permeability rock or unconsolidated materials (gravel, clay or silt) from which groundwater can be usefully extracted using a water well.
Linsley (1985) defined aquifer as the water bearing geologic formation or strata which yield significant quantity of water for economic extraction through well. The study of water flow in aquifer and the characterization of aquifer is called Hydrogeology.
1.2 CLASSIFICATION OF AQUIFERS
Based on the nature, presence or absence of a water table, the following classes of aquifer have been identified.
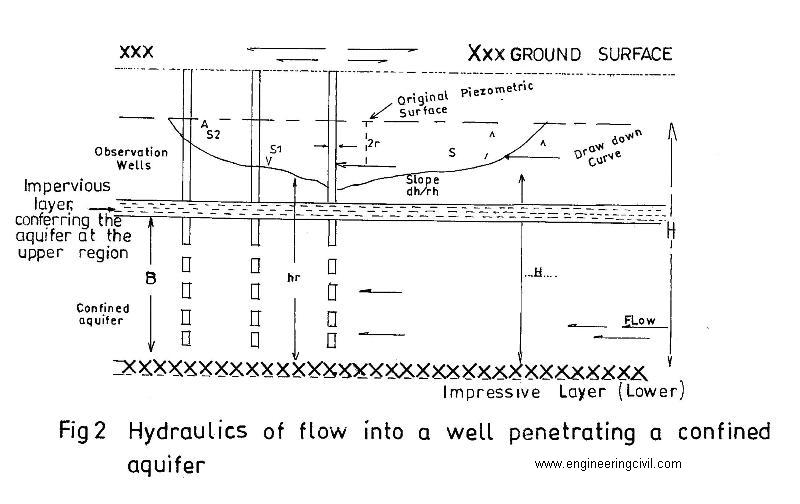
1.2.1 Confined Aquifer
A confined aquifers have very low storativity values (much less than 0.01 and as little as 10-5), which means that the aquifer is storing water using the mechanism of aquifer matrix expansion and the compressibility of water which typically are quite small quantities.
It has a layer of less porous materials above the aquifer, resulting in the ground being under pressure. Ground water is confined under hydrostatic pressure greater than atmospheric pressure of overlying impermeable strata. When a well is drilled, the water in the well rise to the height of hydrostatic head called the presometric surface.
Confined aquifers are also known as artesian aquifer or pressure aquifers (Todd, 1980).
1.2.2 Unconfined Aquifers
Unconfined aquifers are sometimes also called water table or phreatic aquifers because their upper boundary is the water table or phreatic surface. Typically (but not always) the shallowest aquifer at a given location is unconfined meaning that it does not have a confining layer (an aquitard) between it and the surface. Therefore the underlying impermeable rock is located above the main body of groundwater and it is not extensive.
Unconfined aquifers usually receives recharge water directly from the surface, from precipitation or from a body of surface water (e.g. river, stream etc). unconfined aquifers have the storativities (specific yield) greater than 0.01 (1% of bulk volume); they release water from storage by the mechanism of actually draining the pores of the aquifer, releasing large amount of water.
1.3 TYPES OF AQUIFER MATERIALS
Geologic materials can be classified as consolidated rock or unconsolidated (loose) sediment. Consolidated rock may consist of such materials as sandstone, shale, granites and basalt. Unconsolidated sediment contains granular material such as sand, gravel, silt and clay. The four major types of aquifers are:
a) Alluvium: (sand, gravel, and silt deposited by rivers). Aquifers along water courses which consist of alluvium forming channels and the adjacent flood plan.
b) Sedimentary bedrock: Consolidated sediment such as sandstone, shale, granite etc).
c) Glacial Sediment: (unconsolidated materials deposited by glaciers)
d) Igneous or Metamorphic bedrock: Weathered or highly fractured igneous rock or metamorphic rocks granite rocks with fissures and joints
1.3.1 Aquifer Characteristics
1.3.2 Transmissivity
This can be defined as the capacity of reservoirs (aquifer) to transmit water and it is denoted by T. The transmissivity of an aquifer equals the hydraulic conductivity of the aquifer multiplied by the saturated thickness of the aquifer.
Thus, mathematically, T = Kb ————-(1)
Where
T=Transmissivity
K=Hydraulic conductivity
b=Aquifer thickness
1.3.3 Hydraulic Conductivity
The hydraulic conductivity of an aquifer can be defined as the ratio of its transmissivity to the saturated thickness of the aquifer. It is denoted by K.
Thus K = T/b ———– (2)
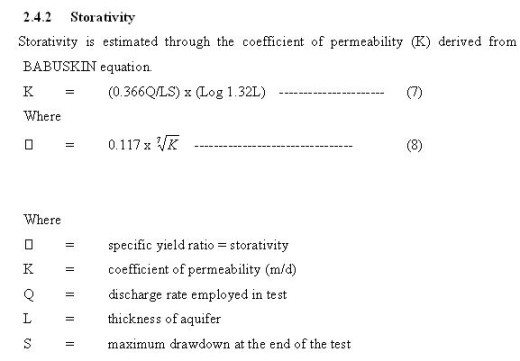
1.3.4 Storativity or Storage Capacity
Storativity is the volume of water that an aquifer releases from or take into storage per unit surface area of the aquifer per unit change in head. It is denoted by S.
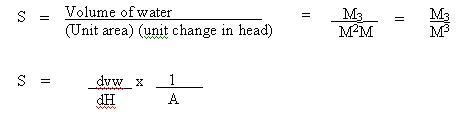
storativity is a dimensionless quantity, and ranges between 0 and effective porosity of the aquifer.
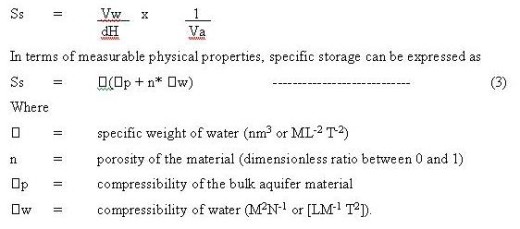
1.3.5 Specific Storage
The specific storage is the amount of water which a given volume of aquifer will produce provided a unit charge in hydraulic head is applied to it (where it still remains fully saturated). It has a unit of inverse length (L-1). It is the primary mechanism for storage in confined aquifers. It can be expressed as the volume of water released from storage per unit declined in hydraulic head in the aquifer, per unit volume of aquifer. The volume of specific storage is typically very small. It is generally 0.00001L/H or Loss.
The compressibility term relates a given change in stress to a change in strain in volume.
1.3.6 Specific Yield
Specific yield is also known as drainable porosity. This ratio is less than or equal to effective porosity, indicating the volumetric fraction of the bulk aquifer volume that a given aquifer will yield when all the water is allowed to drain out under the force of gravity. It is denoted by Sy. Thus:
Sy = Vwd/VT ————— (4)
Where
Vwd = the volume of water drained
VT = the total or material volume
Also, it can be seen as a measure of the volume of water or water yielding capacity that can be obtained from the geologic formulation or rock. The values of specific yield are fractions of the porosity values for the various rocks.
1.4 WELL CHARACTERISTICS
1.4.1 Well Yield
The yield of a well is the volume of water that water well can produce per unit drawdown. It can be expressed as; Sc = (Q/ho = h).
Where:
Sc=specific capacity ([L2T-1]; M2/day or US gal/day)
The expression ho-h represents the draw down in (m) or ft.
1.4.2 Drawdown
This is the difference between the static water level (SWL) and pumping water level at any point. Most commonly, an aquifer test is conducted by pumping water from one well at a steady rate and for at least one day, while carefully measuring the water level in the monitoring well. When the water is pumped from the pumping well, the pressure in the aquifer that feeds that well will decline. This decline in pressure will show up as drawdown (change in hydraulic head) in an observation well. Drawdown decreases with radial distance from the pumping well and increases with the length of time that the pumping continues.
1.5 STUDY AREA
The area under study is the Uyo Metropolis the capital city of Akwa Ibom State, Nigeria. The area of study is located between Latitude 4”030N and 5”030N, 7”030E and 8”015E and has a land mass of about 113.1Km2 situated 55km in land from the Atlantic coast. The study site is contained in the current topographic map of Uyo.
The area is bounded on the North by Ibiono, Itu Local Government Area, on the East by Uruan and on the South by Ibesikpo Asutan and Etinan Local Government Areas and on the West by Abak Local Government Area. It is about 61meters above the sea level and relatively gently sloping from North to the sea.
The area is generally devoid of high land mass, above 10m. It has a recorded annual mean rainfall of 410mm, falling over 170 days of the year and temperature of 30oC. The rainfall and temperature give rise to a high Evapotranspiration. The months of exception of high rainfall are December, January and February when evapotranspiration exceeds precipitation; during the wet season when rainfall far exceeds evaporation losses, there is excess water for surface runoffs, sub surface recharge and in some extreme cases like flooding.
Geologically, the lower unit of the coastal plain sand of the Benin formation constitutes the largest lithostratigraphic unit in the area. This unit is a thick sequence of unconsolidated sand with minor clay/shale interrelations. The map of the area is shown in Fig. 3 while the geological map is shown in Fig. 4 respectively.
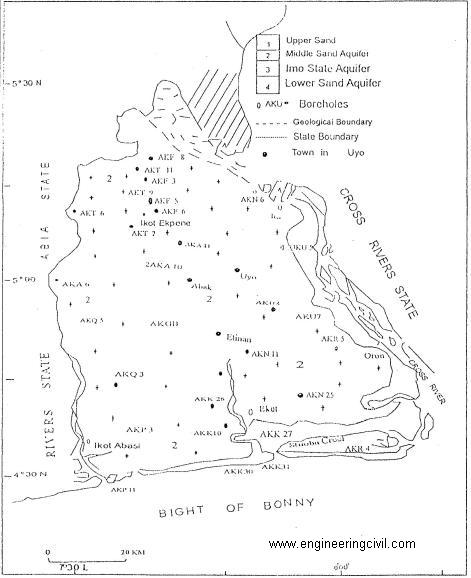
Fig. 3: Map of Akwa Ibom State showing the ariel distribution of hydrostratigraphic units
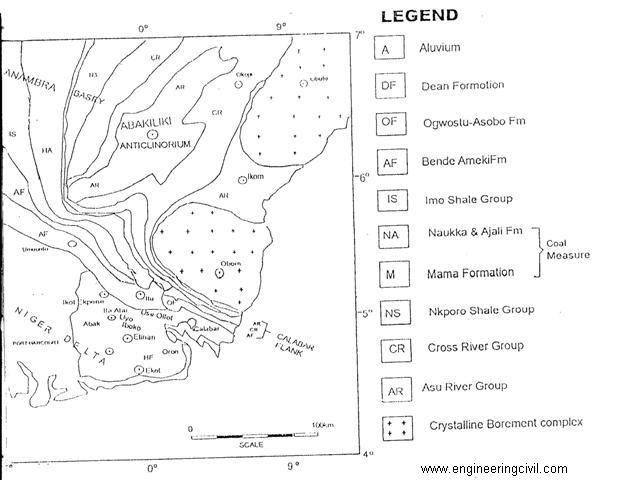
Fig. 4: Geological map of South Eastern Nigeria including the study area.
2.0 MATERIALS AND METHOD
2.1 DATA REQUIRED AND COLLECTION
2.2 ANALYSIS OF DATA
The data analysis is based on two important things which include pumping test data which predict the hydraulic characteristics of the aquifer and grain size data which predict their geological characteristics. The two important instruments that were used for the data collection were the depth sound equipment used in measuring the water level for 24 hours with 30cm rectangular weir tank for measuring the discharge. The second instrument is called Johnson Keck equipment which is launched into aquifer up to a certain depth in order to obtain aquifer material (soil samples or grains) for sieve analysis and to determine the type of formation in three locations namely secretariat, Ewet Housing Estate and Ifa Atai. Refer to the geological map of South-Eastern Nigeria which the study area is included.
The statistic water level, location of water bearing zones, geological material and pump test data are examined to obtain information such as aquifer depth, thickness and nature. This figure is as shown in Fig. 4
2.3 AQUIFER AND WELL HYDRAULIC ANALYSIS
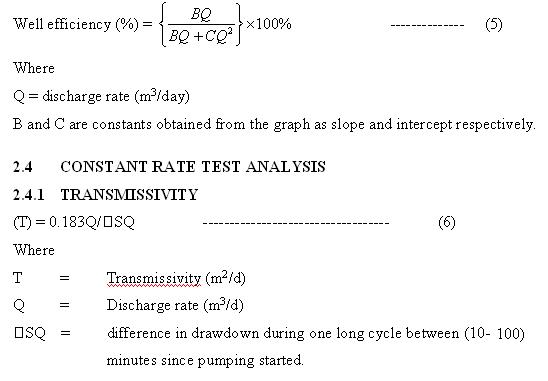
2.3.1 Step Drawdown Test Analysis
Equations 5, 6, 7, 8, 9 and 10 were developed according to (Driscoll and Fletcher, 1983; Etu-Efeotor and Akponodje, 1990; Kazzman, 1965 as well as Health, 1989 and Ineson, 1970.
r = radius of screen
2.4.3 Specific Capacity
Specific capacity (q) = Q/S —————————– (9)
Where
q = specific capacity in m3/h/m
Q = discharge in m3/h
S = drawdown (m)
2.5 EXPECTED DRAWDOWN
Expected drawdown (S) = Q/q ———————– (10)
Where
S = expected drawdown to (m)
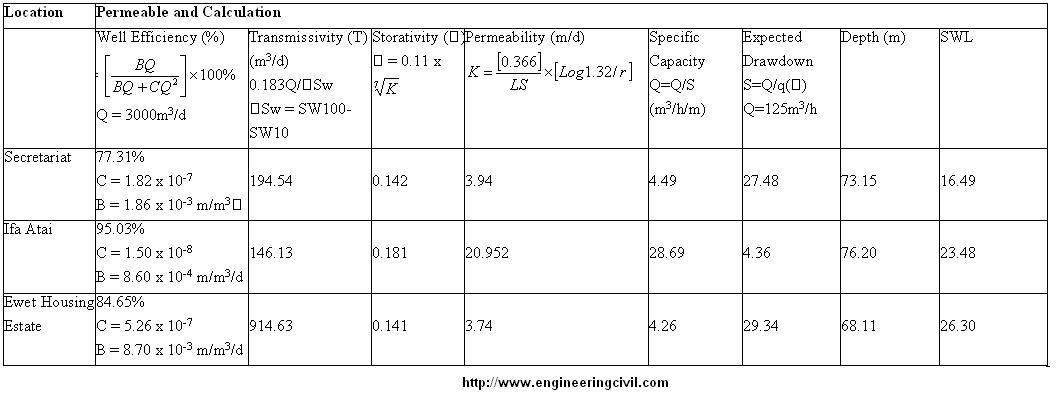
Table 1: Hydraulic Analysis of Well and Aquifer for the three locations
2.6 GRAIN SIZE ANALYSIS (SIEVE ANALYSIS)
The sieve analysis was conducted for the three boreholes and the information obtained was evaluated as follows:
Location 1: Secretariat
| Dept (m) | 91.50 | 110 | 122 | 137 |
| Coarse sand (%) | 0.23 | 70.02 | 0.30 | 2.21 |
| Medium sand (%) | 82.08 | 25.26 | 71.54 | 88.68 |
| Fine sand (%) | 15.27 | 4.71 | 25.49 | 8.24 |
| Silt fraction (%) | 1.60 | 0.48 | 3.02 | 0.31 |
| Total Sample Weight (gm) | 256 | 210.50 | 235 | 321.40 |
Location 2: Ifa Atai
| Dept (m) | 84.84 | 109.08 | 121.20 | 180.28 |
| Coarse sand (%) | 20.43 | 1.15 | 52.08 | 15.93 |
| Medium sand (%) | 74.76 | 78.12 | 46.57 | 80.68 |
| Fine sand (%) | 5.22 | 19.84 | 0.56 | 3.63 |
| Silt fraction (%) | 0.20 | 0.93 | 0.00 | 0.00 |
| Total Sample Weight (gm) | 258.10 | 225.80 | 232.10 | 299.70 |
Location 3: Ewet Housing Estate
| Dept (m) | 82.50 | 90 | 116.25 |
| Coarse sand (%) | 5.64 | 0.88 | 2.66 |
| Medium sand (%) | 87.80 | 76.05 | 46.63 |
| Fine sand (%) | 5.20 | 20.37 | 43.00 |
| Silt fraction (%) | 1.16 | 2.70 | 5.71 |
| Total Sample Weight (gm) | 249.90 | 250.30 | 248.40 |
The description and location of geologic formations and water bearing zones within the formation gives clue as to whether an aquifer is shallow (water is located near the earth or land surface) or deep (water is located deeper, greater than 30 metres) and whether it is made up of consolidated or unconsolidated materials.
3.0 RESULT AND DISCUSSION
Data obtained were analyzed for each borehole. The result of the analysis reveals aquifer with portable water resources and this is in the light of the hydrogeologic parameters deduced from the field data, and the borehole locations as shown in master log at figure 5 below.
i) Hydrologically, permeability values ranges from (3.74-20.952)m/d.
ii) Transmissivity value ranges from (146.13-914.63)m2/d
iii) Storativity value from (0.141-0.181)
iv) Specific capacity value from (4.26-28.69)m3/h/m
v) Well efficiency values from (77.31-95.03)%
vi) Expected drawdown values from (4.36-29.34)m
vii) Static water level (SWL) ranges from (16.49-26.30) m
viii) Depth ranges from (0.0-76.20) m
From 0-10 minutes pumping, water level reduces minimally; 100 minutes water level started declining below 1 meter depth and became stable at different depth (Appendices) for each location. Hence, Ifa Atai has the highest values.
Geologically, at the Secretariat area, the tool (Johnson equipment) was installed at a depth o (143.266m). The log reveals a thick sand layer from (28.956m) to (112.776m) with a very scantily laced clayed zone between (79.248m) and (88.492m) truncates this sand unit and overlies another which penetrated thickness is not worth placing screen for drilling.
In Ifa Atai, the tool was launched to a depth of 149.352m. The log reveals a very thick aquifer from 51.816m – 124.968m only intersected by a clay vein at 100m.
This vein dissects the aquifer into two and thus makes the lower section a more desired interval. The thick clay layer from 124.968m brings in another aquifer at 140.200m. The penetration into this aquifer to 152.40m does not provide enough thickness to be feasible for harnessing.
Consequently, at Ewet Housing Estate, tools were launched to a depth of 106.68m, at this point two sections were identified.
i) (33.5287-53.0m)
ii) (54.864-94.48m). Comprising the lower aquifer, which are of two subsections, each characterized by its aggregate textures, while that from (54.864-71.62m) comprises fine sand, the latter has coarse grain, with a much improved permeability.
From the data obtained in Table 1 concerning hydraulic analysis of well and the aquifer characteristics for the three locations, it was observed that at the secretariat location, the well efficiency was only 77.31%, while the value was higher at Ifa Atai giving efficiency of 95.03% and about 84.65% at the Ewet Housing Estate location.
From Table 1, it also shows that the permeability, transmisivity, storativity, specific capacity, expected draw down also vary depending on the location of the aquifer and depends also on the well efficiency and aquifer characteristics.
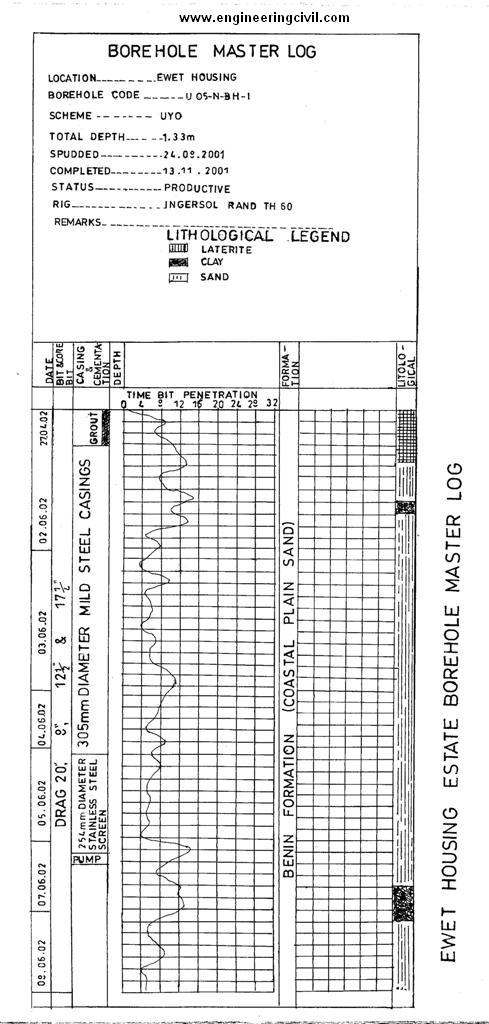
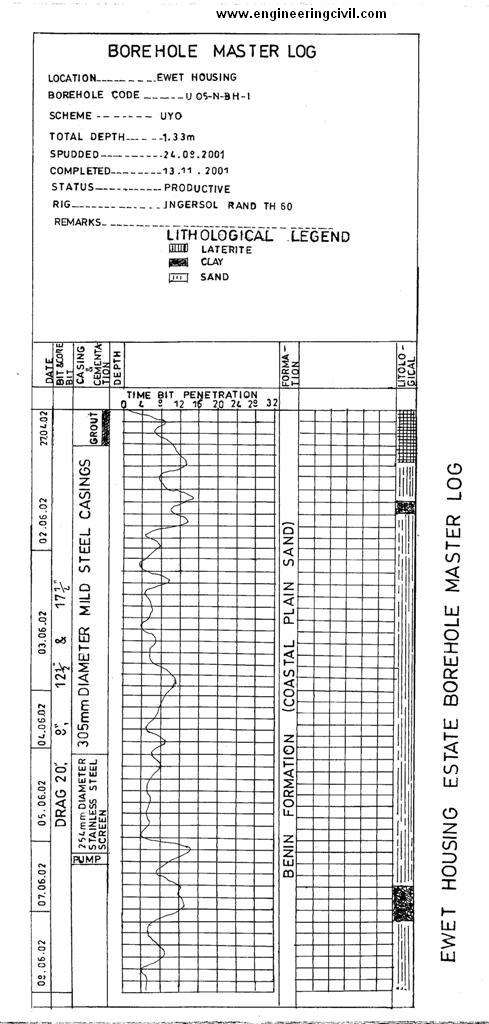
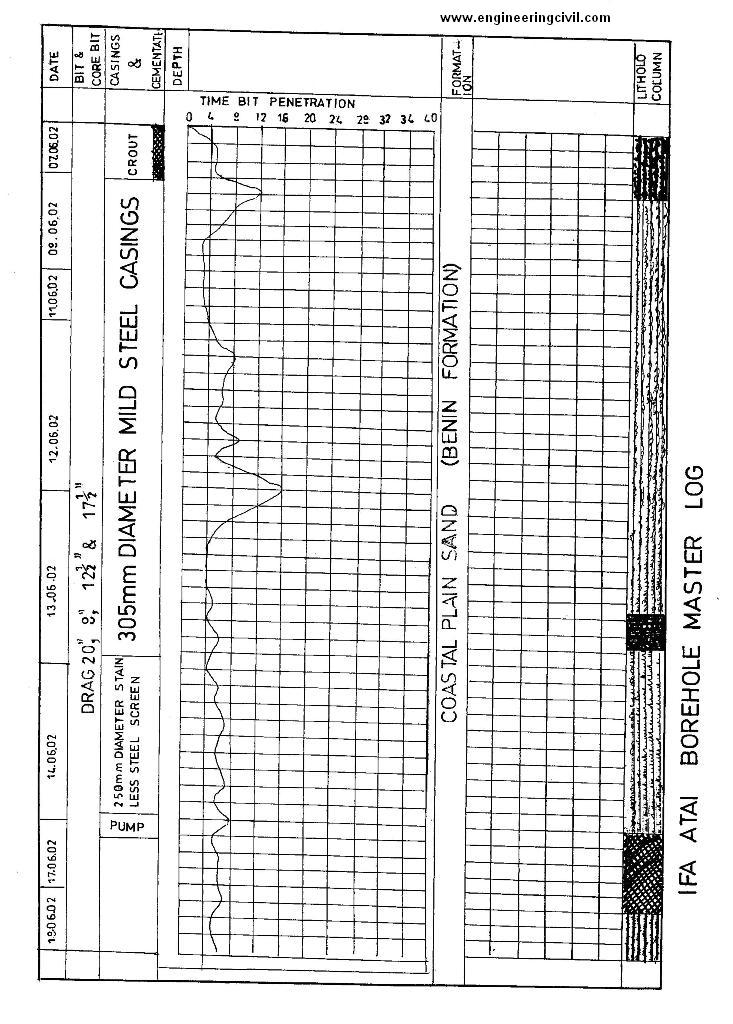

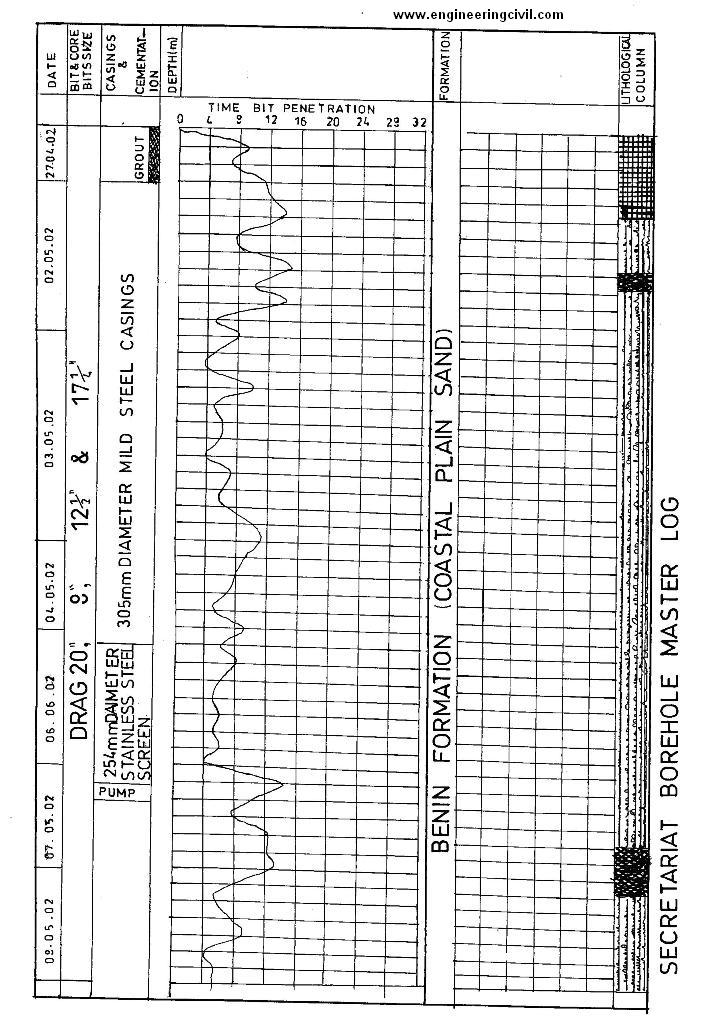
Fig. 5: Borehole master log for Secretariat, Ifa Atai and Ewet Housing Estate
4.0 CONCLUSION
This study was undertaken to identify and understand the hydrological situation and geological content of aquifer within Uyo metropolis. The analysis and result shows that aquifer in the study area have good hydraulic performance, efficiency and good characteristics which makes the borehole in the study area very productive.
Geologically, from sieve analysis report and lithological presentation, Master logs (see Appendix), it can be concluded that the study area has good aquifers at medium sand region.
The aquifer region is composed mainly (mostly) of yellowish, reddish, grayish and whitish sand, gravel and semi-consolidated sandstone with interrelation of clayey layer. The sand distribution is generally from fine to coarse grain and moderately well sorted.
The recharge to the medium sand aquifer is by direct infiltration and percolation from precipitation. Generally, discharge is through abstract from wells and efficient stream.
Finally, all the assessment done in this work from the analysis to the result was to aid determining the aquifer characteristics within the study area (Uyo Metropolis) in order to avoid the incidence of abortive wells and to know the type of geologic materials in this region.
REFERENCES
Ako, A. O., Olorunfemi, M. O. (1989). Surface Geo-electric sounding for the determination of Aquifer characteristics.
Balance R. B. and Jones M. (1996). Aquifer development and Characteristics: Chapman and Hill Publishers, London pp. 114-256.
Driscoll, Fletcher G. (1987). Groundwater and Wells. 2nd Edition, St. Paul, MN: Johnson Division
Etu-Efeotor, J. D.; Akponodje, (1990). Aquifer System of the Niger Delta. Nigerian Journal of Mining Geology, Volume 26(2) pp. 279-284.
Health, Ralph C. (1989). Basic Groundwater Hydrology, U. S. Geology Survey Water Supply Paper 2220.
Ineson, J. (1970). Development of Groundwater Resources in England and Wales, Journal of Institution of Water Engineers, Vol. 24, No. 3, pp. 155-177.
Kazzman, R. G., (1965). Modern Hydrology, Harper and Row.
Linsley, R. (1985). Water Resources Engineering. John Wiley.
Okoro, Chijioke O. (2001). Water Resources Engineering; Groundwater Exploration and Water Well Construction, Newman Services.
Raghunath, H. M. (May, 1987). Groundwater, 2nd Edition, Wiley Eastern Ltd, New Delhi.
Reed, J. E. (1980). Aquifer Test Design, Observation and Data Analysis (PDE) book 3, Application of Hydraulics, U. S. Geological Survey.
Todd, D. K. (1980); (1980 2nd ed) Groundwaters Hydrology, John Wiley.
Walton, W. C. (1970). Groundwater Resource Evaluation Hydrology, John Wiley.
We at engineeringcivil.com are thankful to E. C. UKPONG AND ABARAOGU, UDECHUKWU JOHN for submitting this very useful paper to us.
If you have a query, you can ask a question here.