

By
R.Priya*, O.Ganesh Babu**, M.C.Sashikkumar**, A.Mookambiga**
*M.Tech (Remote Sensing) Assistant Professor, **Assistant Professor, Department of Civil Engineering, Anna University of technology Tirunelveli, Tirunelveli.
ABSTRACT
Spatial differences in drought proneness and intensity of drought caused by differences in cropping patterns and crop growing environments within a basin indicate the need for agricultural drought assessment at disaggregated level. Monthly time composite NDVI images derived from MOD13 (250 m) images from Indian Remote Sensing satellites were analysed along with ground data on rainfall and crop sown areas for the Pisanam seasons (September–December) of 2001 (drought year), and 2007 (normal year). The amplitude of crop condition variability in a drought year (2001) and a normal year (2007) was used to map the degree of vulnerability of different blocks in the basin to agricultural drought. The availability of ground data on rainfall, cropping pattern, crop calendar, irrigation, soil type etc., is very crucial in order to interpret the seasonal NDVI patterns at disaggregated level for drought assessment.
Keywords: Agricultural drought; Disaggregated level; Modis
INTRODUCTION
Drought originates from the deficiency of precipitation over an extended period of time, resulting in a water shortage for some activity, group, or environmental sector. Based on the impact on different activities, droughts are associated with agriculture, animal husbandry and socio economic aspects of society. Agricultural drought is caused by the effect of soil moisture deficiency on the cultivation of crops in the season. Satellite remote sensing is widely used for monitoring crops and agricultural drought assessment. Information on agricultural drought is useful for in season management of crops, end of season management of crop production and assessment of crop loss.
Over the last 20 years, coarse resolution satellite sensors have been used to routinely monitor vegetation and indices such as the Normalized Difference Vegetation Index (NDVI) are being used to detect the impact of moisture stress on vegetation (Tuckers and Sellers 1986, Gitelson and Merzlyak 1997). Remote sensing based agricultural drought assessment is developed on the difference in spectral response characteristics for different vegetation conditions.
The reflected radiation in the wavelengths 0.60 to 0.70 um (Red) and 0.70 to 1.25 um (Near infra-red) bear close relationship to biomass, leaf area index (LAI), leaf water content and other plant canopy parameters. Out of the various vegetation indices available, Normalized Difference Vegetation Index (NDVI) is very widely used as it minimize the effect of change in illumination condition and surface topography. The NDVI is defined as the ratio of difference between the near infrared and red reflectance to their sum.
Land use of Chittar sub-Basin
A region or a district consists of vegetation from agricultural land cover (crop areas) and non-agricultural land cover (forest lands, permanent fallows, barren and rocky areas) in different proportions. Classification of land use pattern in Chittar sub- basin contains 66.04% of agricultural land, 4.64% of built up land, 13.04% of forest, 5.83% of water and 10.45% of wasteland. The main crop in Chittar sub – basin is paddy. As the flow is perennial, as much as 95% of paddy crop occupies two crop seasons. The first crop season is synchronized with the Southwest monsoon between June to September called Kar and the second is with Northeast monsoon called as Pishanam between September to December.
Objective
The main objective of the present study is
1) To analyze rainfall status across the study area.
2) To assess the need for agricultural drought assessment at disaggregated level by analyzing the amplitude of the seasonal NDVI changes between a drought year and a normal year
MATERIALS AND METHODS
Study Area
Chittar sub-basin of Thamiravaruni basin has been chosen for the present study since it has many dry regions within the perennial river basin. Thamiravaruni irrigation system is the one of the major systems in Tamil Nadu with a command about 77,500 ha irrigating Tirunelveli and Thoothukudi districts. Chittar river is the largest tributary of the Thamiravaruni river. It lies between 8045’and 9015’ Latitudes and between 77010’and 77050’ Longitudes. The eastern part of the sub-basin is generally plain with the lowest elevation of about 60 to 80 m above MSL and the slope ranging from is less than 1%, whereas in the west, the topography is undulating plains and the slope ranges from 1 to 3%. The high hills of the Western Ghats mark the western boundary of the sub-basin. The climate of the sub-basin is generally semi-arid. The maximum temperature ranges between 30° C and 37.5° C and the minimum temperature between 20° C and 27°C. The months of March, April, May and June are hottest depending on the location within the basin, and the cooler months are November, December and January.
Rainfall Analysis
Monthly rainfall data from 14 raingauge stations in Chittar basin were collected from Ground water Division, PWD, for the from 1999-2009 as shown in figure 3.
Remote Sensing Based Agricultural Drought Assessment
Remote Sensing based agricultural drought assessment is based on comparative analysis between the normal and deficit years. The year can be declared as normal or excess or deficit based on the following conditions:
(i) Normal year – + -18% of long-term basin average.
(ii) Excess year – >+18% of long-term basin average.
(iii) Deficit year – <-18% of long-term basin average.
Based on the 10 years basin average rainfall of 813 mm, it was found that rainfall in the years 2000, 2003, 2004, 2005, 2007 and 2009 were under normal, the year 2008 and 2006 were under excess and the year 1999,2001 and 2002 were under deficit conditions.
Agricultural Drought assessment
In this study % deviation carried out by comparing the NDVI values in the deficit year (2001) with the normal year (2007). In the first stage, from the deficit and normal year NDVI images, percentage NDVI image for deficit year was obtained by applying the following equation
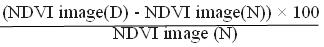
Based on the ranges of high negative (NDVI (%)) value indicate the severe drought condition.
RESULTS AND DISCUSSION
Drought is a normal feature of the climate and its recurrence is inevitable. All droughts originate from a significant reduction in precipitation extended over a season or longer and result in water deficit. Evaluation of drought risk due to the dry spells of water and the demand placed by the human activity is important to promote the proactive approach to mitigate the effects of drought on the natural resources and the population.
Statistical Analysis of Rainfall Data
Ten years of monthly rainfall data were collected for the fourteen rainfall stations in the Chittar sub basin. These data were entered in MS Excel and analyzed for variation in space and time for months, seasonal and annual data.
The first moment was obtained for all the 14 rain gauge stations from the record of rainfall for 10 years by adding all the data and dividing it by the number of data. This provides the mean or the average of precipitation over the year or over the series. The average precipitation for the basin is 812.90mm.
Agricultural drought assessment within the basin
The NDVI values of a drought year (2001) and a normal year 2007 do not show much significant deviation from each other at aggregated level i.e. at basin level in pisanam season (September – December)
CONCLUSIONS
The vegetation indices are effective parameters to identify the growth levels of plants and NDVI can effectively be used for monitoring growth rate of Plants. The approach was based on MODIS remote sensing data and ground-observed precipitation data. The value of % deviation (NDVI) was within the range of -75.45 to +59.15, based on the reclassification negative values indicates the severe drought and positive values indicates the normal condition for agriculture. Five grades of drought severity were identified to indicate various degrees of drought severity: severe drought, moderate drought, mild drought, very mild and normal condition. The approach was applied to chittar sub – basin for drought severity monitoring in the main growing seasons from September to December, which generated a maps showing spatial distribution of drought severity for every months period in the chittar sub – basin. The monitoring results showed that the drought severity on average was very low in 2001 in the chittar sub – basin. Higher severity of drought could be seen in the periods of September and October.
REFERENCE
1. Krishnaveni,M (2003), “ Remote Sensing based Drought Information System for Palar and Thamiravaruni Basins using GIS “ Anna university, Chennai.
2. Dracup, A. (1980), “On the Definition of Droughts”, Water Resources Research, Vol.16, No.2, pp.297-302.
3. Eklundh, L. (1998), “Estimating relations between AVHRR NDVI and rainfall in East Africa at 10-day and monthly time scales”, International Journal of Remote sensing, Vol. 19, No. 3, pp. 563- 568.
4. Murthy C. S., Sesha Sa M. V. R., Bhanuja Kumari V. and Roy P. S. (2007), “Agricultural drought assessment at disaggregated level using AWiFS/WiFS data of Indian Remote Sensing satellites”, Geocarto International, Vol. 22, No. 2, pp. 127–140.
5. Richard Y. and Poccard I. (1998), “A statistical study of NDVI sensitivity to seasonal and interannual rainfall variations in Southern Africa”, International Journal of Remote sensing, Vol. 19, No. 15, pp. 2907- 2920.
6. Wan Z. and Wang P. (2004), “Using MODIS Land Surface Temperature and Normalized Difference Vegetation Index products for monitoring drought in the southern Great Plains, USA” , International Journal of Remote sensing, VOL. 25, NO. 1, pp. 61–72.
We at engineeringcivil.com are thankful to Priya.R for submitting this very useful research to us. We are sure this will be of great help to others who are looking forward to research in this field.
If you have a query, you can ask a question here.