

By
S.S. KOLO, (Civil Engineering Department, Federal University of Technology, Minna, Nigeria), Y.A.JIMOH (University of Ilorin, Nigeria) AND P. N.NDOKE(Civil Engineering Department, Federal University of Technology, Minna, Nigeria)
Abstract
This paper presents the outcome of the axle load survey on a section of a rural trunk road in Nigeria in order to ascertain the contribution of overloaded goods vehicles to pavement failure. Seven day classified traffic and axle load survey was conducted for the determination of ADT, percentage heavy vehicle and the imposed axle load at respective axle position for the traversing vehicles on the Old Jos –Kaduna road, Kaduna state Nigeria. The proportion of the vehicle laden weight carried by each axle and the corresponding standard axle load (sal) was computed with the index model of power 4. The percentage and magnitude of overloaded axles were respectively determined as an indicative measure of the extent of structural damage to the pavement. The studied pavement was overstressed up to five times beyond the Nigeria standard axle load of 80kN, which was too high and hence constituting the hindsight to frequent structural damage to road pavements in Nigeria. It was recommended that the axle load control with weigh-in-motion weighing bridges to assure protection of the road from failure be instituted that will impact less disturbance to normal traffic flow on the arterial.
Keywords
Commercial Vehicle, Average Daily Traffic, Design life, Axle Load, Gross Weight and Gross Vehicle Weight
1.0 INTRODUCTION
Traffic data are collected for many reasons and different types of information, such as hourly traffic flow, total daily or annual traffic volume, traffic / vehicle type and mix etc. Traffic is usually conducted with either the manual or automatic procedure.In pavement design, light vehicles are not considered to cause any significant damage to structural layers that constitute the pavement and so in principle,do not need to be counted accurately nor indeed hardly need to be counted at all (Howe (1972). Thus vehicles of less than 1.5tonnes empty weight for example: motorcycles, cars, small (mini and midi) buses or small trucks with single rear tyres for structural damage assessment purposes are usually discarded. However, large buses, light to medium goods vehicles, heavy and very heavy articulated trucks are weighed in the axle survey exercise because they constitute the damaging influence on the pavement.It is not the wheel load but rather the damage to the pavement caused by the wheel load that is of primary concern. In fact it has been proved that damage increases sharply as the axle load exceeds 1.5tonnes and as such vehicles of weight over that value are usually considered to have the structural damage to the pavement (State of Florida, 2008).Thus, the most common historical approach is to convert damage from all the wheel loads of various magnitudes and repetitions for mixed traffic to structural damage in equivalent number of standard loads, which is normally express in million equivalent standard axles (mesa). The standard and legal axle in Nigeria is 80kN.
The annual Average Daily Traffic (AADT or ADT) is the most widely used traffic statistic to indicate the level of traffic volume on a road. The knowledge of the composition of the vehicles using a road and respective imposed wheel load (from the axle weight) is also important in order to determine if the pavement was overstressed. Forkenbrockand March, 2005, while reporting Stoke and Albert’s argument for the need for Truck-only lane, enumerated a list of benefits why specialized lane should be reserved in the traffic situation. The list is substantially in agreement with the three conditions stipulated by the Southern California Association Road agency. The truck-only lanes would be most feasible when (i) truck volumes (goods vehicles)exceed 30% of the mix vehicles (ii) one way traffic volume is greater 1800vehicles per lane-hour during the peak hours and (iii) off-peak volume in each direction exceeds1,200 vehicles per lane-hour. This observation pointed out the general phenomenon that heavy truck traffic in low proportions constitutes much damage factor to the pavements and needs be given the desired attention. Indeed pavement wears increase with axle weight, the number of axles,the spacing and configuration within each axle group(such as for tandem-tridem-axle groups), the size and type of tyres as well as the suspension tyre pressures(Hort et al., 2008).
On the other hand and for economic evaluation, the numbers of vehicles in each category are of equal importance as the structural damage and so a similar level of accuracy is needed. In practice it is rare for a traffic count to be conducted for only one purpose and so the same level of accuracy is adopted for all types of traffic survey. An axle load survey is usually carried out to determine the axle load distribution of the goods vehicles (GV) on the road in order to determine the number of equivalent standard axles for a typical heavy vehicle in the traffic mix to be combined with the respective traffic flow to forecast the design life of a pavement in terms of millions of equivalent standard axles (mesa),Jones(1997). An axle load survey will also provide important information about the degree of overloading, axle load distribution (in frequency and magnitude)for traffic travelling over a road. Significant differences in axle load between the two directions of flow of traffic can also occur on a road;especially trunk roads leading to ducks, quarries, cement works,timber lumbering regions,oil extraction and mineral mining areas.The equipment for determining the structural loading system on a road pavement include i) a fixed weighbridge ii) Portable weighing pads and iii) Weigh-in-motion equipment (Howe,1972). It is relatively convenient to use the fixed weighbridge if it exists near the study road than directing traffic to a nearest one at some distance way. However, the most common method of carrying out an axle load survey is to weigh a sample of vehicles at the roadside using portable weighing pads(Jones and Gizzaw, 1977). Using this method, it is possible to weigh about sixty to hundreds of vehicles per hour per set of weighing pads, depending on traffic levels, site layout, type of equipment, number of staff and their experience. It is however important that the drivers of overloaded vehicles are not prosecuted during the survey in order to obtain the most realistic situation of traffic loading on the road because any indication that this is likely to happen will cause the drivers to alter their routes and avoid the survey. The drivers on the other hand may intentionally reduce the load being carried; which will eventually lead to an inaccurate axle load data. Hence special precaution might need to be taken to ensure that the survey does not influence traffic flows or loading patterns unduly.
It is common knowledge that pavement of rural freeways that carry heavy goods importation and exportation suffer structural breakdown too often and too soon in their life, because of the overloading of the trucks Jones (1977). The scenario thus identified has resulted in excessive demand on maintenance, which is not easily achieved. A strategy of ensuring effective maintenance and at the same time offer the desirable quality of service and utility is to control the damage from the vehicles, often manifesting when overloaded. The desirable data in deciding on the most appropriate option is the axle load characteristics (Highway Research Board, 1962).
2.0 MATERIAL AND METHOD
2.1 Study Area.
The axle load measurement was taken at the existing fixed weighing bridge located at the premise of Sunseed Nig. PLC,Dakace, Old Jos road, Zaria. The road passes by the frontage of the Federal College of Education Zaria and through the Kongo Campus of the Ahmadu Bello University, Zaria Kaduna State, Nigeria.The road links Zaria, the educational centre of the old northern region and in the present north western geopolitical zone with Jos, the headquarters of the famous Jos plateau mineral deposit, in the present north central political zone.
2.2 Study Procedure
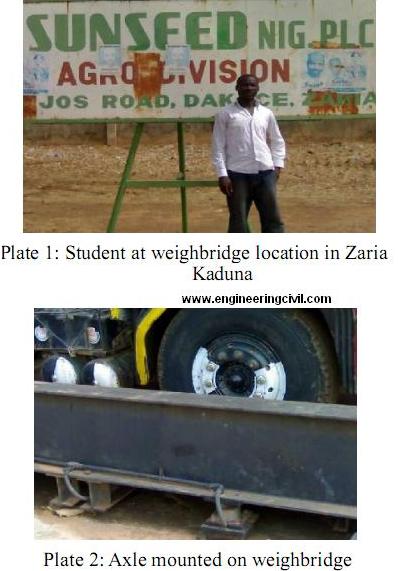
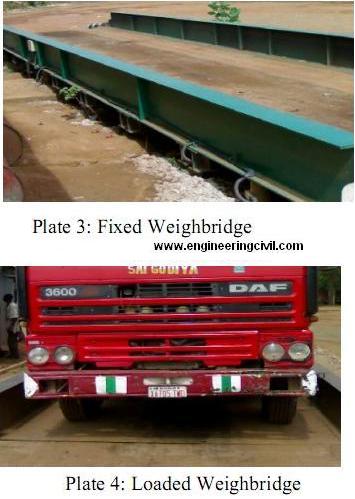
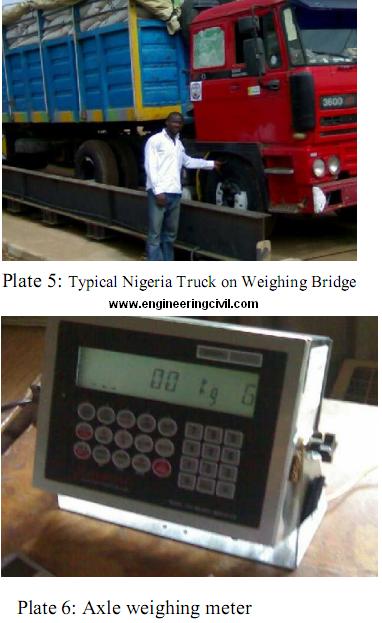
At first, a reconnaissance survey was carried out in order to assess the condition of the road, the category of vehicles plying, the inventory (width) of the road and other site suitability criteria for the conduct of traffic and axle survey. The traffic survey was then conducted for the month of June 2008 at a position suitable enough to prevent direct contact with the sunlight, obstruction from traffic and pedestrian activities. For the traffic volume survey, at least two observers with separate count forms were used at all times–one for each direction of flow(Parsley, 1994). The duration of one month, (four weeks) was used for the survey in order to obtain data that would appropriately reflect the uniformity in activities of the community for the weekly circle. The traffic was grouped according to the classification in the latest edition of the Nigerian Highway Manuel (Federal Ministry of Works, 2006). The axle survey was however conducted for only one week (7days) and limited to the vehicles ordinarily considered to cause structural damage to the pavement. The vehicles in this category include the medium truck (2 axles with twin rear tyres), heavy trucks with two or more axles; (2-axle for medium trucks, 3-axles for heavy trucks, and 4-axles for heavier trucks) and large buses. While weighing the axles, sampling coverage of each of the category of vehicle in appropriate portions to the flowing traffic stream was ensured. The complete procedure for the axle survey was as contained in (Hartanto and Sastrowiyote, 1990) and also sequentially demonstratedin Plates 1 -6.
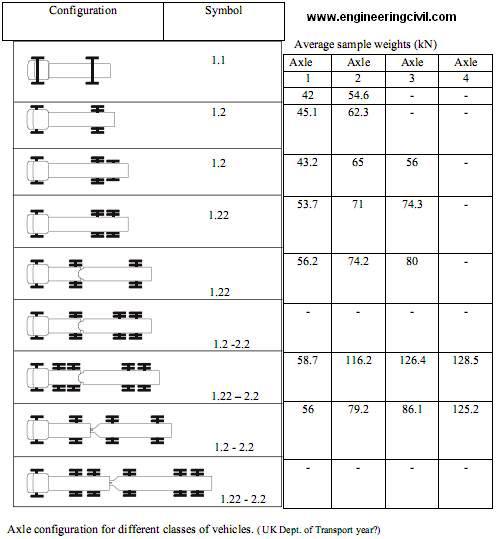
As a sample vehicle was approaching the weighing bridge zone, the sensitive axle load weighing meter was adjusted to zero reading. The respective axle load for each axle position as well as the vehicle weight as displayed in other sections of the meter were noted, Plates 6, 7and 8). The configuration of axles counted and weighed for the purpose of this research work is shown in figure 1. Each vehicle axle was then converted to standard (80 kN) axle load using equation (1) to obtain the respective equivalent factors for the damaging effect of the vehicle on the pavement.This process was repeated for all the categories of the vehicles that have damaging effect as analysed in the traffic count (Parsley and Ellis, 2003 and Rolt, 1981).
EF= (Axle load/ 80KN)4 ——— 1
During the course of data collection, the common errors that arose were strictly monitored. These errors include i) drivers of over loaded vehicles were avoiding the survey site as soon as they learnt of the presence of the survey officers ii) inaccurate data due to short duration of one or two days count iii) the effect of traffic directional split iv) the loaded and unloaded empty truck of the same type and v) wrong entry during the data processing. Appropriate checking and supervisory roles at different levels of responsibilities and vigilance was established throughout the axle measurement. By and large,at least three days of continuous measurement was adhered to with the use of adequate number of enumerators (personnel).
3.ANALYSIS OF RESULTS.
3.1 Traffic Analysis
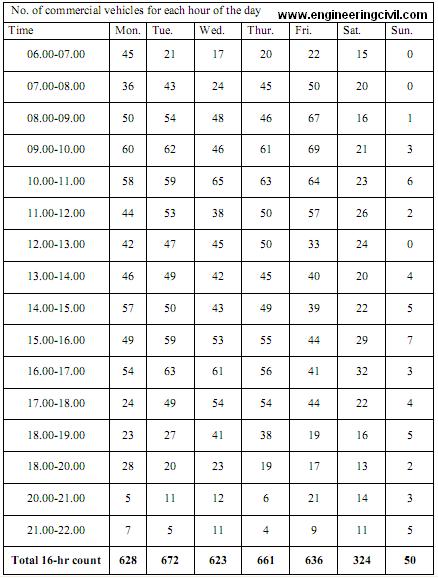
Table1 presents the traffic survey data for a week. The average number of goods vehicles in the week = (5 x average weekday traffic) + Saturday + Sunday traffic, which was computed to be 534(3739/7) . In order to account for the non-commercial vehicles per day for the Average Daily Traffic (ADT), which was obtained to be approximately 1,000 passenger cars, the two figureswere added to give the ADT of 1,534. This implies that the percentage trucks to total vehicle per daywas35% (534/1534), and that the annual traffic loading on the rural road studied is 194,910 trucks, (534 x 365).
Table 1: Hourly vehicles count on the studied road.
3.2 Axle load analysis.
Table 2 is the summary of the axle load measurement conducted, which reflects only those vehicles likely to cause structural damage to the pavement. The axles considered include those for large buses, 2-axle medium trucks, 3-axle heavy trucks and the 4-axle heavier trucks. The axle analysis was conducted under four different perspectives; i) the average standard equivalent factor per vehicle ii) the proportion of overloading axles iii) the magnitude (in unit of weight) of 7 overloading relative to the legal axle and iv) the load distribution factors on the various axles of a truck. Also the standard axle was taken as 80kN on dual tyres at the two ends of the axle and 40 kN weight on single tyres for the front axles; both respectively designated as [2] and [1] in the axle configuration. (Fig. 1)
Table2: Data display for the axle load survey
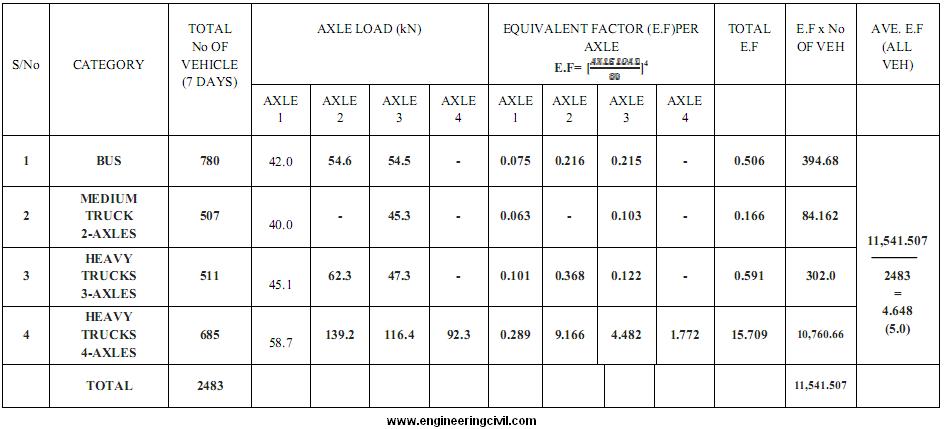
3.2.1Computation of equivalent standard axle factors
From the axle weight conversion shown in table (2), it can be seen that an average goods vehicle on the road adopted as case study, possesses an average equivalent factor of (4.648), approximate 5 (11,541.507/2483), which is about five times the standard axle weight for road pavements. This implies that an average truck on the road studied caused the same pavement damage as five standard axles of 80kN would cause. It shows that there is high degree of overloading on the said road which is one of the major causes of pavement deterioration. Also, the percentage of commercial vehicles that is causing structural damage to the pavement is 35% (535/1535), while the corresponding equivalent standard axle factor per vehicle was 2.575(11541.507/4483).3.2.2 Proportion of overloaded axles
With the standard axle of 80kN resting on dual tyres (designated as [2]) on axle configuration, it can be assumed that the axle on single tyres is 40kN (designated as [1]). In line with above assumptions applied to the data of Table 2, the respective overloaded axles are computed as:-
Number of front axles [1]overloaded: Bus [122] (780) + for 3 –axle (511)+ for 4 –axle (685) = 1976
Number of back and other axles [2]overloaded: 4 –axle 3(685) = 2055
Total number of truck axles = 3(780) + 2(507) + 3(511) + 4(685) = 7627
Therefore, the proportion of overloaded axlesf or the trucks (the goods vehicle) = (1976 + 2055)/7627 = 4031/7627 = 52.85% and 41.87% for entire traffic.
3.2.3.Magnitude of axle overload
For front axle [1], the percentage over load beyond the 40kN for the 42, 45.1 and 58.7 are respectively 5, 12 and 47%. For back and other axles [2], the percentage over load beyond the 80 kN for the 139.2, 116.4 and 92.3kN are respectively 74.0, 45.5 and 15.4. The magnitude of overloading of axles recorded for a goods vehicles range from 5 –74%, with an average of 21.3% for front and 45% for the back and other axles.
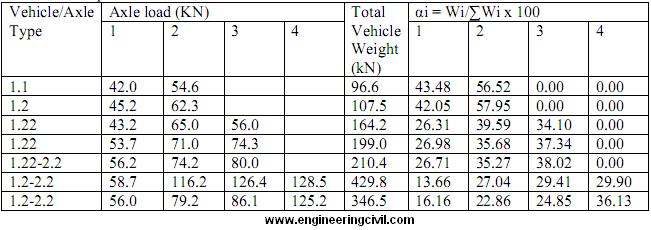
3.2.4.Proportion of vehicle load per axle.
Table 3 gives the distribution of the vehicle laden and unlade loads over the respective axles. It varies for the number of axles and position in the vehicle chassis layout. The back and other axles carry the highest proportion of the load on the vehicle. The highest load on the axle is significant to be employed in the determination of the wheel load magnitude in the structural design of a pavement, which can be estimated from the number of axles with equation 2.
HAL = BVL/N (2)
Where HAL is the highest axle load, VL is the load on the vehicle, N is the number of the axles on the vehicle and B is the modification factor which varies with N. The respective values are 13 –16, 12 –19 and 20 –45% for the 2-, 3-and 4-axles.
Table 3: Computation detail of load distribution for each of the various vehicles
4.0 DISCUSSION OF RESULTS
4.1. Traffic Survey Data
As seen from the traffic count data (table 1), it is obvious that the movement of commercial/ goods vehicles is more during the weekdays and Saturdays. However for Sunday,the total count of commercial vehicles amounted to just 50, which shows that there is a drop in movement of goods and passengers haulage on Sundays. So, care must be taken when carrying out a traffic count to reflect the variation in the traffic generating activities which was observed to be approximately the same in a weekly circle. Hence traffic counts should be carried out for a minimum period of 7-days to include the five week and two week -end days, in order to clearly show the reality of the prevalent traffic scenario on a typical rural road in Nigeria.
4.2 The axle load data
A total of 2,483 goods vehicles (trucks)of various categories were counted each possessing an average equivalent factor of 5.0 for the seven days of survey. This means that on the average, each goods truck on the road causes five times the damage of the standard weight legally permitted on the pavement of Nigerian rural road. The computed value is far too high and excessive and can constitute the major reason for the deterioration of road pavements in Nigeria. The challenge therefore needs to be more forcefully addressed for the survival of the nation’s road asset.
4.3 Design life
It is impossible to design a road pavement which does not deteriorate with time and traffic. The pavement design life is a specified period of time for which the road pavement layers themselves should not deteriorate to any serious extent and pavement distress (in the form of roughness, rutting and cracking). The 5.0 esa per goods vehicle per day cannot be realistically used to determine the lifespan of a flexible pavement of a rural road in Nigeria, since there are other lighter vehicles.The esa per vehicle should be a better factor.
4.4 Axle load overloading in quantity and proportion.
The proportion (%) of axles overloaded on the studied rural road was computed to be 45%. This value indicated that there is the need to introduce Trucks Only Lane because it exceeded the 30% bench mark usually adopted for rural freeway by the American Federal Highway Administration, (Forkenberg and March, 2005). Both the front axles and the rear and other axles are all overloaded on the rural freeway to as much as 21and 45% respectively. The finding implies that the imposed loads by the axles on the Nigerian pavement are as much as 11.5 tonnes, which is extremelyhigher than the 8 tonne legal axle weight. These results obviously confirm that the pavement should be over stressed; hence the notorious collapse of the Nigerian roads. There is the strong reason to consider as important other alternative mode of hauling goods in the rural regions in Nigeria. This objective can be achieved by either i) modification of the goods vehicle chasis through the introduction of more axles to the trucks or ii) discourage road haulages of goods and
promote the rail means of carriage more appropriatelyor iii) both taken together.
The highest distribution of the vehicle load over the axles (computed with eq.2) gives a fast method of estimating the maximum load to be imposed on the wheels and hence the contact pressure on the pavement. The contact stress is a major input in the mechanistic analysis of the structures of the pavement.
5.0 CONCLUSION AND RECOMMENDATION
5.1 Conclusions
a) The average equivalent standard axle per goods vehicle of 5.0 (corresponding to an axle load of 400kN) operates on a typical regional road in Nigeria with the implied high degree of overstressing of the road pavement structure.
b) Fifty three percent (52.9%) of axles of the goods trucks on a rural road in Nigeria are overloaded but only 42% of entire traffic,including the lighter passenger cars which confirm the need to create Trucks Only Lane for the rural roads.
c) The front axles are 21% overloaded in magnitude while the back and other axles are 45% averagely overloaded thereby making it imperative to raise the legal axle to 11.6 tons, at least.
d) The distribution of the vehicle load on the back axle is the highest and about 40% for 3 or more axles.
5.2 Recommendations
i) There is need to revive the glory of railway transport system in order to ease the pressure of over stressing of road pavement and or in combination with reconfiguration of the chasis layout of (the architecture)of the goods trucks to accommodate more axles.
ii) Rigid pavement should be constructed in areas where traffic is dominated by heavy duty and vehicles because of its capability in accommodating higher traffic wheel induced stresses.
iii) Routine and periodic maintenance practices should be encouraged in order to reduce the effect of the overloaded wheels on the pavement before the deterioration gets worse and maintenance becoming n-effective.
iv) The global best practices in controlling the access of over loaded trucks through the effective operation of weighing bridges should be strongly enforced on Nigeria rural freeways.
v) The study is recommended to be undertaken on other rural freeways so that a nationwide strategy is formulated to preserve the nation’s road network.
REFERENCES
Eastman C R (1988), “Evaluation of portable weighpads”, Contractor Report CR114.
Crowthorne:
Forkenbrock, David and March, Jim, (2005), Issues in the Financing of Truck-Only Lanes;
Publications of US Department of Transportation, Federal Highway Administration,
www.tfhre.gov, Sept/Oct, 9-17.
Federal Ministry of Works (1997) “Nigeria General Specifications (Roads and Bridges) Volume II, Federal Republic of Nigeria.
Hartanto B and Sastrowiyoto S (1990),“Axle load measurement at the toll road in Jakarta”, 6 th REAAA Conference, Kuala Lumpur.
Highway Research Board (1962).“The AASHO Road Test”,Report No. 7 Howe J D G F (1972),Areview of rural traffic-counting methods in developing countries.
Laboratory Report LR427. Crowthorne: TRL Limited.
Jones T E (1977),“Axle loads on paved roads in Kenya”, Laboratory Report
Jones T E and Gizaw Gulilat(1977),“The commercial traffic loading on five trunk roads in Ethiopia”, JointRoad Research Project Report No. 10, Addis Ababa: Ethiopian Roads Authority.
Parsley L.L.(1994). “A guide to using simple inductive loop detectors for traffic counters in developing countries”. Project Report PR/INT/270/2003. Crowthorne.
Parsley L L and Ellis S D,(2003), “Guidelines for short period traffic counts in developing countries”, Project Report PR/INT/270/2003. Crowthorne.
Rolt J (1981).“Optimum axle loads ofcommercial vehicles in developing countries”,Laboratory Report LR1002. Crowthorne: TRL Limited.
State of Floride (2008) Project Traffic Forecasting Handbook, on line at http://teachamerica.com/tih/PDF/ProjectTrafficforecastingPTF2008 Final%20 Draft Publis.pdf.
We at engineeringcivil.com are extremely thankful to Er. Kolo Stephen Sunday for sharing his research on A Study of Axle Overloadings On A Rural Road In Nigeria . We hope this will be of great help to students who are doing work on understanding the Axle Loading’s on roads.
If you have a query, you can ask a question here.
Tanx for this great work