

By
Naveen G.M 1, Vinay Kumar B.M2
1. Lecturer, Dept. of civil Engg, V.V.I.E.T, Mysore.
2. Lecturer, Dept. of civil Engg, V.V.I.E.T, Mysore.
Abstract
Sound comes from the vibrations in molecules, and is always traveling through a substance, whether it is a solid, liquid, or gas. Sound cannot travel through a vacuum because there are no molecules for the sound to travel through. Noise pollution (or environmental noise) is displeasing human-, animal- or machine-created sound that disrupts the activity or balance of human or animal life. A common form of noise pollution is from transportation, principally motor vehicles. Noise health effects are both health and behavioral in nature. The unwanted sound is called noise. This unwanted sound can damage physiological and psychological health. Noise pollution can cause annoyance and aggression, hypertension, high stress levels, hearing loss, sleep disturbances. In the present study, attempts are made to study the noise level range at different roads of the Mysore city. Traffic behaviour and characteristics at various roads near schools, hospitals, railway tracks, offices, courts, etc. using “Sound Level Meter”. Then, the maximum value of noise level in decibels is Estimated.
Keywords: Noise and Sound level meter.
INTRODUCTION
Noise can be described as sound without agreeable musical quality or as an unwanted or undesired sound. Thus noise can be taken as a group of loud, non harmonious sound or vibration that is unpleasant and irritating to the ears. “Noise Pollution” is a form of pollution, which does not give any residue. The noise pollution is due to the contribution of modern civilization, the main causes of which are Urbanization, Mechanized means of transport & new devices of Recreation & Entertainment. The modern civilization creates more noise, because of the development of Industry, Machinery & Technology. It has increased in factories, in hospitals, in colleges, theatres, at building sites & in the countryside. The Noise, unwanted sound has penetrated almost every aspect of modern life. It is potentially a serious signal & grave threat to the environment & health. The increased level of noise pollution affects the welfare of Human life, Animals, Plants & Structures & finally affects their existence. The noise pollution is highly complex & different from other forms of pollution.
A decibel is a standard for the measurement of noise. The zero on a decibel scale is at the threshold of hearing, the lowest sound pressure that can be heard, on the scale acc. To smith, 20 db is whisper, 40 db the noise in a quiet office. 60 db is normal conversation, 80 db is the level at which sound becomes physically painful.
Broadly speaking, the noise pollution has two sources, i.e. industrial and non- industrial. The industrial source includes the noise from various industries and big machines working at a very high speed and high noise intensity. Non- industrial source of noise includes the noise created by transport/vehicular traffic and the neighbourhood noise generated by various noise pollution can also be divided in the categories, namely, natural and manmade.
Most leading noise sources will fall into the following categories: roads traffic, aircraft, railroads, construction, industry, noise in buildings, and consumer products
1. Road Traffic Noise.
2. Air Craft Noise.
3. Noise from railroads.
4. Construction Noise.
5. Noise in Industry.
6. Noise in building.
7. Noise from Consumer product
Harmful Effects:
1. It decreases the efficiency of man.
2. Lack of concentration.
3. Fatigue.
4. Abortion is caused.
5. It causes Blood Pressure.
6. Temporary of permanent Deafness
7. Effect on vegetation.
8. Effect on animals
9. Effect on Property
Transmission of noise
Noise is transmitted in the following ways:
1) Through air.
2) By vibrations of structural members
3) Through structural members.
Transmission of noise through air is more common. In this sound waves travel through openings of doors, windows, etc. When the source of sound is very near, sound wave impinge or strich on thin structural member such as partition walls, membrane walls, etc. These structural membranes vibrate and in turn set up secondary sound waves to the other side. The third type of transmission takes place when elastic wave motions, consisting of compression & rarefactions of sound, are transmitted from particle to particle of the structural member, in the form of pressure impulses. Such a mode is prevalent where mechanical vibrations are caused, such as factories, workshops, etc.
Transmission losses:
When sound is transmitted from the source or the origin to the adjoining room/area, reduction in sound intensity takes place, this is known as transmission loss. It is Numerically equal to the loss in the intensity of sound expressed in decibels.
LITERATURE REVIEW
The study examines the problem of noise pollution in the wake of its ill effects on the life of people. A survey of the population in Delhi State points out that the main sources of noise pollution are loudspeakers and automobiles. However, female population is affected by religious noise, a little more than male population. Major effects of noise pollution include interference with communication, sleeplessness, and reduced efficiency. The extreme effects e.g. deafness and mental breakdown neither is ruled out. Generally, a request to reduce or stop the noise is made out by the aggrieved party. However, complaints to the administration and police have also been accepted as a way of solving this menace. Public education appears to be the best method as suggested by the respondents. However, government and NGOs can play a significant role in this process.
Sources of noise:
All transportation systems create noise pollution. With residences created adjacent to factories, they experience noise pollution and its adverse effects. Besides transportation noise, noise can come from factory appliances, power tools and audio entertainment systems.
Measures of noise:Noise pollution is measured in decibels. When noise is at 45 decibels, no human being can sleep, and at 120 decibels the ear is in pain and hearing begins to be damaged at 85 decibels.
Table1: The magnitude of noise levels from some common noise sources.
| SERIAL NO. |
TyPE OF SOURCE OF NOISE |
NOISE LEVEL IN DECIBELS |
|
1 |
Light Road Traffic (Side Streets) |
60 -70 |
|
2 |
Medium Road Traffic Streets) |
70-80 |
|
3 |
Heavy Road Traffic (Highways) |
80-90 |
|
4 |
Rail Traffic |
90-110 |
|
5 |
Air Traffic |
90-110 |
Scope of present Study
1. Identify sources of noise pollution
2. Consider the problem caused by noise pollution.
3. Use the decibel scale
4. Suggest ways of reducing noise Pollution.
In the proposed study, attempts are made to study the noise level range at Mysore Road. Traffic behaviour and characteristics at various places like highways, schools, hospitals, along the railway tracks, offices, courts, etc. using the sound measuring instrument ,“Sound Level Meter”. Then, the maximum value of noise level in decibels is taken and suggestions are given for reducing the noise pollution.
TRAFFIC SURVEY
Mysore, the administrative seat of Mysore District is one of the second largest cities in Karnataka and is situated in the southern part of the state at 770 m above sea level at latitude of 12°18’ N and longitude of 76°42’ E. The city is located at a distance of about 135 km from Bangalore, the capital of the state. The administrative area of Mysore City Corporation (MCC) is approximately 140 square kilometres.
Site Characteristics
Location 1
The first choice of the road is the JSS hospital road in Agarahara nearly 2 km away from the city bus stand (main city).it is the one of the older and famous general hospital having high traffic intensity causing hazardous traffic noise. The reduction of traffic noise is very essential because it decreases the efficiency of man, Lack of concentration, Fatigue, Abortion is caused, and also causes Blood Pressure, Temporary or permanent Deafness.
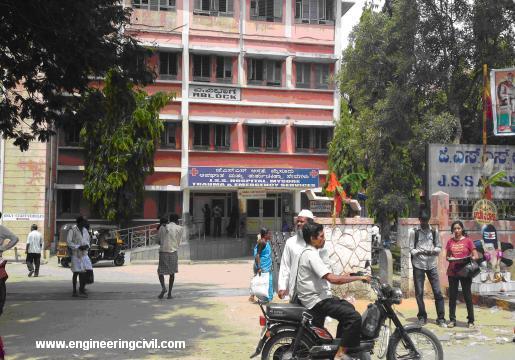
Fig 1: Survey carried out at Ramanuja Road near JSS Hospital on 22/02/2010.
Traffic density
Table 2: Traffic Density of Ramanuja Road near JSS Hospital from 9:00 a m-11:00 a m.
| Category of vehicles | 9.00- 9.15
am |
9.15-9.30
am |
9.30-9.45
am |
9.45-10.00
am |
10.00-10.15
am |
10.15-10.30
am |
10.30-10.45
am |
10.45-11.00
am |
| Two wheeler | 460 | 426 | 370 | 380 | 412 | 464 | 406 | 378 |
| Car | 83 | 73 | 88 | 72 | 81 | 92 | 86 | 77 |
| Auto | 99 | 135 | 100 | 118 | 94 | 168 | 97 | 113 |
| Buses | 8 | 3 | 8 | 7 | 5 | 7 | 8 | 3 |
Table 3: Traffic Density of Ramanuja Road near JSS Hospital from 1:00 p m-3:00 p m.
| Category of vehicles | 1.00-
1.15 pm |
1.15-
1.30 pm |
1.30-
1.45 pm |
1.45-
2.00 pm |
2.00-
2.15 pm |
2.15-
2.30 pm |
2.30-
2.45 pm |
2.45-
3.00 pm |
| Two
wheeler |
345 | 366 | 350 | 269 | 260 | 253 | 260 | 268 |
| Car | 73 | 67 | 58 | 55 | 65 | 60 | 69 | 66 |
| Auto | 98 | 86 | 88 | 74 | 76 | 69 | 89 | 97 |
| Buses | 6 | 4 | 2 | 5 | 2 | 3 | 2 | 3 |
Table 4: Traffic Density of Ramanuja Road near JSS Hospital from 5:00 p m-7:00 p m.
| Category of vehicles | 5.00-
5.15 pm |
5.15-5.30
pm |
5.30-
5.45 pm |
5.45-
6.00 pm |
6.00-
6.15 pm |
6.15-
6.30 pm |
6.30-
6.45 pm |
6.45-
7.00 pm |
| Two
wheeler |
403 | 399 | 410 | 407 | 389 | 385 | 387 | 398 |
| Car | 112 | 98 | 100 | 115 | 110 | 97 | 99 | 98 |
| Auto | 154 | 133 | 143 | 147 | 138 | 141 | 139 | 145 |
| Buses | 5 | 6 | 2 | 7 | 3 | 5 | 3 | 2 |
Location-2
The second choice of the road is the Narayanshastri road near Sadvidya nearly 0.75 km away from the city bus stand (main city). It is the one of the older and famous institution in Mysore city having high traffic intensity causing hazardous traffic noise. The reduction of traffic noise is very essential because it decreases the efficiency of man, Lack of concentration, It causes Blood Pressure, Temporary or permanent Deafness in students in the institution.
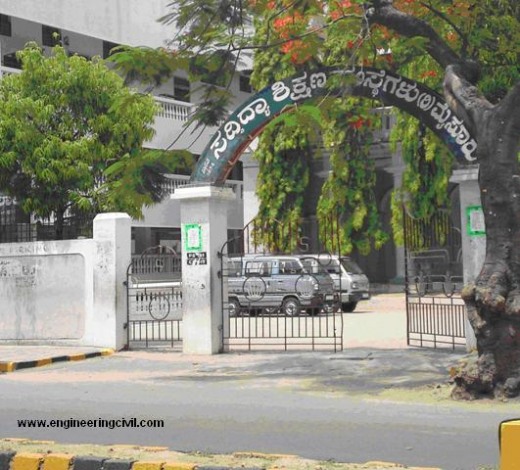
Table 5: Traffic Density of Narayanshastri Road near Sadvidya School from 9:00 a m-11:00am
| Category of vehicles | 9.00-9.15
am |
9.15-9.30
am |
9.30-9.45
am |
9.45-10
am |
10-10.15
am |
10.15-10.30
am |
10.30-10.45 am | 10.45-11.00 am |
| Two wheeler | 452 | 445 | 455 | 361 | 376 | 363 | 350 | 344 |
| Car | 160 | 154 | 144 | 165 | 134 | 117 | 98 | 110 |
| Auto | 130 | 121 | 113 | 136 | 119 | 98 | 115 | 134 |
| Buses | 4 | 5 | 2 | 3 | 6 | 10 | 15 | 7 |
Table 6: Traffic Density of Narayanshastri Road near Sadvidya School from 1:00 pm-3:00pm
| Category of vehicles | 1.00-
1.15 pm |
1.15-
1.30 pm |
1.30-
1.45 pm |
1.45-
2.00 pm |
2.00-
2.15 pm |
2.15-
2.30 pm |
2.30-
2.45 pm |
2.45-
3.00 pm |
| Two wheeler | 355 | 243 | 245 | 238 | 240 | 229 | 232 | 245 |
| Car | 68 | 76 | 65 | 63 | 65 | 62 | 66 | 61 |
| Auto | 99 | 110 | 96 | 95 | 97 | 94 | 88 | 94 |
| Buses | 4 | 6 | 3 | 7 | 4 | 2 | 2 | 1 |
Table 7: Traffic Density of Narayanshastri Road near Sadvidya School from 5:00 pm-7:00pm.
| Category of vehicles | 5.00-
5.15 pm |
5.15-5.30
pm |
5.30-
5.45 pm |
5.45-
6.00 pm |
6.00-
6.15 pm |
6.15-
6.30 pm |
6.30-
6.45 pm |
6.45-
7.00 pm |
| Two
wheeler |
398 | 387 | 355 | 393 | 388 | 385 | 387 | 398 |
| Car | 107 | 93 | 110 | 119 | 100 | 93 | 96 | 99 |
| Auto | 158 | 136 | 148 | 153 | 146 | 145 | 143 | 147 |
| Buses | 7 | 4 | 3 | 7 | 6 | 2 | 3 | 2 |
Location-3
The third and last choice of the road is the court road nearly 5 km away from the city bus stand (main city). It is the one of the high traffic intensity road in Mysore city having causing hazardous traffic noise. The reduction of traffic noise is very essential because it decreases the efficiency of humans working in court yards, Lack of concentration during judgement; It causes Blood Pressure & Temporary or permanent Deficiency in people inside the court.
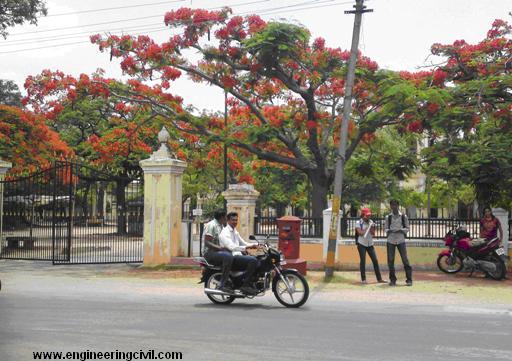
Table 8: Traffic Density of Court Road from 9:00 am-11:00 am.
| Category of vehicles | 9.00-9.15
am |
9.15-9.30
am |
9.30-9.45
am |
9.45-10.00
am |
10.00-10.15
am |
10.15-10.30
am |
10.30-10.45
am |
10.45-11.00
pm |
| Two wheeler | 390 | 388 | 310 | 347 | 330 | 297 | 308 | 298 |
| car | 95 | 85 | 70 | 87 | 78 | 70 | 75 | 80 |
| Auto | 120 | 117 | 94 | 98 | 116 | 90 | 119 | 122 |
| Buses | – | 1 | 2 | – | – | 1 | – | 1 |
Table 9: Traffic Density of Court Road from 1:00 pm-3:00 pm.
| Category of
vehicles |
1.00-
1.15 pm |
1.15-
1.30 pm |
1.30-
1.45 pm |
1.45-
2.00 pm |
2.00-
2.15 pm |
2.15-
2.30 pm |
2.30-
2.45 pm |
2.45-
3.00 pm |
| Two wheeler | 230 | 210 | 265 | 244 | 254 | 233 | 198 | 202 |
| car | 78 | 85 | 83 | 97 | 87 | 88 | 86 | 81 |
| Auto | 98 | 85 | 119 | 99 | 96 | 97 | 95 | 89 |
| Buses | 1 | 2 | 1 | 2 | 1 | – | – | 1 |
Table 10: Traffic Density of Court Road from 5:00 pm-7:00 pm.
| Category of vehicles | 5.00-
5.15 pm |
5.15-
5.30 pm |
5.30-
5.45 pm |
5.45-
6.00 pm |
6.00-
6.15 pm |
6.15-
6.30 pm |
6.30-
6.45 pm |
6.45-
7.00 pm |
| Two wheeler | 419 | 398 | 388 | 330 | 415 | 390 | 385 | 300 |
| car | 86 | 90 | 96 | 98 | 80 | 88 | 72 | 78 |
| Auto | 110 | 95 | 87 | 99 | 85 | 94 | 97 | 110 |
| Buses | 1 | – | – | 1 | – | 2 | 1 | – |
METHOD OF TESTING
Sound measuring instrument
Sound Level Meters (SLM) measure Sound Pressure Level (SPL) and are commonly used in noise pollution studies for the quantification of almost any noise, but especially for industrial, environmental and aircraft noise. However, the reading given by a sound level meter does not correlate well to human-perceived loudness; for this a loudness meter is needed. The current International standard for sound level meter performance is IEC 61672:2003 and this mandates the inclusion of an A-frequency-weighting filter.
Working principle of sound level meter
Sound level meter is an instrument, which indicates, sound pressure levels(SPL) in the audible range. Its purpose is to provide a result, which can give a reasonably good indication of human perception of the measured sound.
Sound level meter consists of basically of
a) Microphone.
b) An electronic circuit, including attenuator, amplifier, weighting networks of filter and an indicating meter or display unit.
It measures, the root mean square sound pressure with the aid of a microphone that converts the signal to an equal electrical signal. The signal is passed to weighting network, which provides a conversion and gives the sound pressure level in dB.
Standard for sound level meters specify performance characteristics example frequency response, signal averaging and tolerance so that consistent readings are obtained under identical conditions.
Three weighing networks are provided in standard sound level meters in an various loudness levels (A, B and C). These weighting networks cause the sensitivity of the meter to vary with frequency and intensity of sound like sensitivity of human ear.
The A- weighting network is the most useful one on sound level meter for measuring human response and many noise measurement standards; recommended its use. It indicates the A- weightened sound level abbreviated dB (A).
The root mean square measurements are related to an average time, the three time constants used for the sound level standards are:
S (Slow): 1s (Sound)
F (Fast): 125MS
I (impulses):35MS (rise) and 1.55(decay)
Relatively steady sounds are usually measured using “fast” response, unsteady can be averaged with the sluggish “slow” slow meter response to specify limits of exposure in terms of dB(A) as measured with slow meter response. Many sound level meters also include a peak detector, when measurements are necessary assessing ear damage risk when the noise has impulse contents.
When measuring long-term noise exposure, noise level is not always steady and may vary considerably, in an irregular way over the measurement period. A standard level meter will provide a varying output from which it will be difficult to decide what sound level is, this uncertainty can be solved by measuring the maximum sound recorded for every 5 minutes for a period of 1 hour or more. From these readings we can find maximum value of sound produced for that interval. This uncertainty can even be solved by measuring the continuous equivalent level (Leq), e.g. which is defined as constant sound pressure level, which would have produce the same total energy as the actual over the given measurement period. Measurement of Leq requires the use of integrated sound level meter.
Using of Sound Level Meter
This section describes how to use physically the instrument in order to correctly measure the noise level existing at the point where the microphone is placed. The following steps must be taken successively:
1. Batteries must be checked before use and during long measuring sessions.
2. A wind shield must be used if the air velocity is noticeable. It should anyway be used all the time as a dust shield.
3. The microphone should be oriented as described previously.
4. All intruding objects such as the body of the sound level meter (SLM) or the operator itself will degrade the frequency response of the microphone at high frequencies and directivity effects will appear at much smaller frequencies. Therefore, the SLM should be, whenever possible, installed on a stable and sturdy tripod equipped with resilient blocks to isolate the sound level meter from vibration and consequent spurious readings. The operator should be at a reasonable distance (2-3 m) behind the sound level meter. Extension cables should be used if possible when measurements are to be made in a restricted area . When the instrument makes it possible, an extension rod should be used for the microphone. For walk-through surveys, the SLM should be held well away from the body.
5. The SLM must be calibrated before any measuring session using a calibrator. If the temperature of the instrument is significantly different from the ambient temperature where it will be used, it should be first warmed up before calibration and use. The calibration must be checked at the end of the session. If the instrument is not calibrated anymore, the data might have to be discarded and the reasons for this calibration change should be investigated as this might indicate an important malfunctioning of the instrument.
6. Nowadays, it is much more advantageous to use an integrating sound level meter to determine.
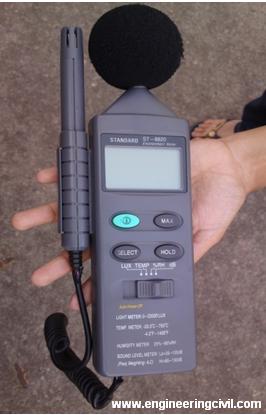
Fig 4: Sound Level Meter IES 61672-2003.
Results and discussions
Noise measurements were carried out using sound level meter. Number of sound level meter used was 1. The SPL data were collected in interval of 5minutes at 3 stations. The measurements have been carried out during peak hours
RAMANUJA ROAD NEAR JSS HOSPITAL
Date: 22/02/2010
NARAYANSHASTRI ROAD NEAR SADVIDYA SCHOOL
Date: 23/02/2010
COURT ROAD
Date: 03/05/2010
TIME (minutes) V/S SOUND PRESSURE LEVEL (dB)
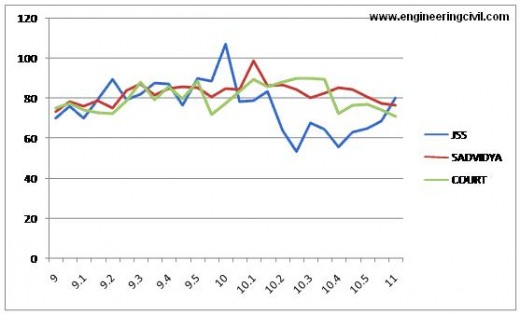
Fig 5: Time (minutes) v/s Sound pressure level (db)
ANALYSIS:
Survey is conducted in time duration 9.00am to 11.00am.
INTERPRETATION:
From the above survey conducted it is observed that the sound pressure level is maximum i.e., 107dB at RAMANUJA road near JSS HOSPITAL at 10.00 am.
TIME (minutes) V/S SOUND PRESSURE LEVEL (dB)
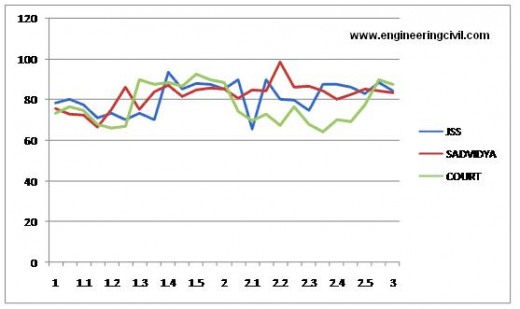
Fig 6. Time (minutes) v/s Sound pressure level (db)
ANALYSIS:
Survey is conducted in time duration 1.00 PM to 3.00 PM.
INTERPRETATION:
From the above survey conducted it is observed that the sound pressure level is maximum i.e, 93.5 dB at RAMANUJA road near JSS HOSPITAL at 1.40 PM.
TIME (minutes) V/S SOUND PRESSURE LEVEL (dB)

Fig 7: Time (minutes) v/s Sound pressure level (db)
ANALYSIS:
Survey is conducted at time duration 5:00 PM to 7:00 PM.
INTERPRETATION:
From the above survey conducted it is observed that the sound pressure level is maximum i.e., 100.1dB near court road at 5.20 PM.
CONCLUSION
Based on experimental investigations the following conclusions can drawn
1. The sources of noise pollution vary in places to places.
2. Knowing what/how much noise we are dealing with.
3. It is observed that the sound pressure level is maximum i.e., 107dB at RAMANUJA road near JSS HOSPITAL at 10.00 am
4. In all places above 80 db is recorded ,hence sound becomes physically painful.
REFERENCE
1. “Characteristics of vehicles producing excessive noise and ground borne vibration”.TRL Report PPR 202. TRL, Crowthorne, UK.
2. “Control of Body Noise from Commercial Vehicles – Guide to Best Practice”. Department of the Environment, Transport and the Regions, London, UK, 2000.
3. Deutche, Presse-Agentur, “Noisy cities make them dumb”, Business Line, 10th May 2003.
4. F.Asdrubali, F. D’Alessandro and S. Schiavoni, “Sound Absorbing Properties of materials made of rubber crumbs”, Perugia, Italy, Jully 29th to july 4th(2008).
5. Harris, C. M. (Ed.) Handbook of acoustical measurements and noise control. 3rd edition,New York, McGraw-Hill, Inc, 1991.
6. Narendra Singh and S. C. Davar,“Noise Pollution- Sources, Effects and Control”, 2004.
7. Rao, P.R., India, “Noise Pollution and Control, Encyclopedia of Environmental Pollution and Control ”. Vol.-2, Environ media Publications, 1995.
We at engineeringcivil.com are thankful to Sir Naveen G.M Gowda for submitting this case study and helping all those who wanted to know about this topic.
If you have a query, you can ask a question here.
Hello sir
My project is sound absorbing materials by using natural available raw material
Plz help me about this project